The Alaska Fisheries Science Center had many scientists who attended the annual meeting of the North Pacific Anadromous Fish Commission (NPAFC) which was held 11-14 May 2015 in Kobe, Japan, and culminated with the 3-day “International Symposium on Pacific Salmon and Steelhead Production in a Changing Climate: Past, Present, and Future.”
The history of Pacific salmon catches from the North Pacific regions was updated through 2014 (Table 1). The total catch was 392 million fish or 864,000 t. Catches were reported by the United States (345,800 t, 40% of total weight; Alaska totals 328,000 t); Russia (336,100 t , 39% of total weight); Japan (144,300 t, 17%); Canada (37,700 t, 4%), and Korea (437 t, < 1%). Chum and pink salmon constituted the majority of the total catch (38% and 36% by weight, respectively). Sockeye salmon comprised 20% and coho salmon was 5% of the commercial catch by weight. Chinook comprised 1.4% and cherry salmon and steelhead trout each comprised < 1% of the commercial catch by weight.
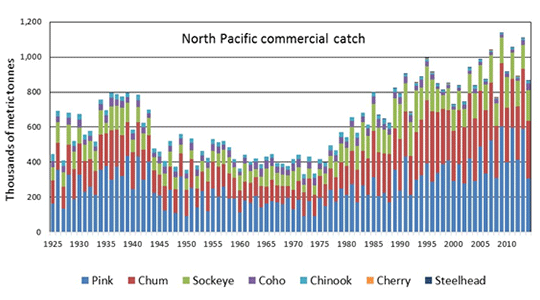
Figure 1. North Pacific commercial catch (thousands of metric tonnes) of Pacific salmon by species from 1925 to 2014 (2014 catches are preliminary).
Pacific salmon abundance in the North Pacific, as indexed by aggregate commercial catches, remains at near all-time high levels (Fig. 1). The highest catches on record occurred during the four most recent odd-numbered years (i.e., 2007, 2009, 2011, and 2013) when more than 1.0 million t were caught. More adult salmon caught in odd-numbered years than even years because pink salmon, are most abundant in odd-numbered years. The total catch in 2014 was 864,000 t which shows a recent falling trend in the last several even-numbered years (2010, 2012, 2014).
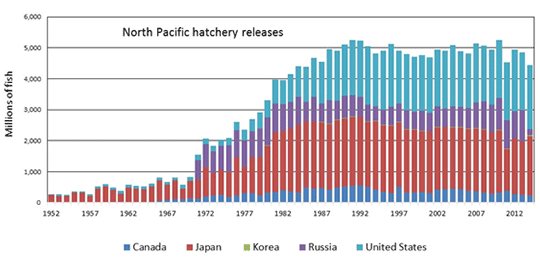
Figure 2. Annual North Pacific hatchery releases (millions of fish) of Pacific salmon by member countries from 1952 to 2014.
North Pacific salmon hatchery releases have been fairly stable for the last few decades at a total of approximately 5.0 billion fish released (Table 2, Figure 2). Favorable marine conditions for pink and chum salmon and improved hatchery technologies have played a role in increasing the abundance of chum and pink salmon in Asia. Pink and chum salmon remain the primary species released from North American hatcheries.
Proposed Research Cruises: The Parties to NPAFC reported on their following cruise plans:
Canadian cruise plans for salmon research in 2015 are planned for the waters surrounding Vancouver Island and central British Columbia and in the Salish Sea. These cruises will be conducted by the CCGS W.E. Ricker (summer, fall), CCGS Neocaligus (summer), and a chartered fishing vessel (summer).
Japanese cruise plans for salmon research in 2015 are planned for the central Bering Sea (summer) and western North Pacific (spring). The R/V Hokko maru and the R/V Oshoro maru will conduct these surveys, respectively.In addition, Japanese research vessels are scheduled to conduct 15 high-seas research cruises for pelagic fishes and squids in the North Pacific Ocean in 2015. These surveys have a possibility of incidental salmon catch during fishing operations with driftnets, trawl, or saury dip-net.
Russian cruise plans for salmon research in 2015 will occur in the northwestern North Pacific (summer) and western Bering Sea (summer and fall) and southern Okhotsk Sea and adjacent waters (fall). These surveys will be conducted by the R/V Professor Kaganovsky: R/V Professor Levanidov, and R/V TINRO.
United States cruise plans for 2015 are scheduled in Southeast Alaska (spring-summer), Gulf of Alaska (summer), southeastern Bering Sea (late summer-fall), and the northern Bering Sea (late summer). The survey vessels used will include R/V Sashin and F/V Northwest Explorer, a chartered trawl vessel, R/V Oscar Dyson, F/V Alaska Endeavor, and R/V Pandalus.
Table 1. Preliminary 2014 commercial salmon catches in Canada, Japan, Korea, Russia, and the United States. Commercial catches by foreign fleets in the Russian EEZ are not included.
(a) Preliminary 2014 commercial catch in millions of fish.
Sockeye
Pink
Chum
Coho
Chinook
Cherry
Steelhead
Total
Canada
9.288
4.239
0.717
0.274
0.318
-
-
14.837
Japan
-
2.397
40.882
0
0.001
-
-
43.281
Korea
-
-
0.144
-
-
-
-
0.144
Russia
14.788
108.477
43.237
5.106
0.110
0.004
-
171.722
USA
44.827
95.717
12.414
7.209
1.795
-
0.069
162.031
Alaska
44.085
95.716
11.236
6.276
0.506
-
0.001
157.820
WOC
0.741
0.001
1.178
0.933
1.288
-
0.069
4.211
Total
68.903
210.831
97.394
12.589
2.223
0.004
0.069
392.014
WOC: Washington, Oregon, and California
(b) Preliminary 2014 commercial catch in metric tons (round weight).
Sockeye
Pink
Chum
Coho
Chinook
Cherry
Steelhead
Total
Canada
24,712
6,594
3,630
781
1,981
-
-
37,698
Japan
1
3,451
140,014
1
6
807
-
144,281
Korea
-
-
411
-
-
-
-
411
Russia
37,606
147,566
135,840
14,478
641
7
-
336,139
USA
114,647
149,366
47,745
23,908
9,819
-
188
345,673
Alaska
112,747
149,363
42,545
21,069
3,080
-
-
328,803
WOC
1,900
3
5,200
2,839
6,739
-
188
16,870
Total
176,966
306,977
327,641
39,167
12,447
814
188
864,202
WOC: Washington, Oregon, and California
Table 2. Preliminary 2013 hatchery releases in NPAFC member countries in millions of fish.