Fig. 4, Model results of predicted EBS pollock biomass following the AVO index (AVO=Acoustic Vessel of Opportunity) with and without inclusion of the index. Error bars represent assumed 95% confidence bounds.
The sum of the ABCs for 2012, as recommended by the Scientific and Statistical Committee, is about 2.51 million t, nearly the same as for 2011 totals (2.53 million t). The largest component is EBS pollock ABC (1.22 million t for 2012 compared to 1.267 million t in 2011). The largest ABC increase (97,000 t) came from Pacific cod, which in 2011 was 272,000 t.
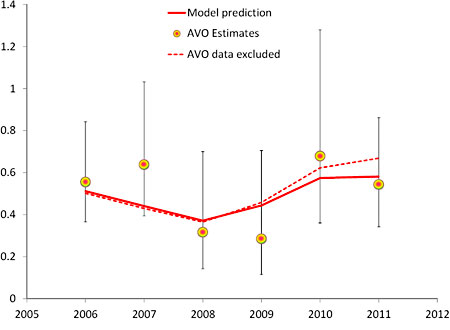
In 2011 the AFSC's survey resources were devoted to the Gulf of Alaska which means that new survey data was generally unavailable for the Aleutian Islands and Bering Sea Slope region. In these years, assessments for long-lived rockfish species consisted of an executive summary. In 2012 the AFSC anticipates being able to conduct groundfish surveys in the Aleutian Islands and complete full assessments for these species. EBS Pollock: Data on the eastern Bering Sea pollock stock showed mixed signals relative to surveys from 2010. The anticipated increased biomass in the bottom trawl survey was absent (a 17% decline in the survey from the 2010 estimate) primarily due to the lower appearance of the 2006 and 2008 year classes.
Since the acoustic trawl survey was diverted to the GOA, information on the younger pollock was lacking. However, new in this years assessment was the opportunistically collected acoustic data from the bottom trawl survey boats as they transited between bottom trawl stations. This new index spanned 2006-11 and represents a new index to evaluate midwater pollock
(Fig. 9 above).
The AFSC's MACE program scientists are to be credited with their efforts to provide this new index. Other new presentations in the assessment include an evaluation of catch rates from shore-based catcher vessels (tons of pollock per hour towed) and an examination of the fact that younger fish are generally farther from port and what type of impact that might have on Optimal Yield estimates (where economics are taken into account due to added fuel costs for trips farther from port).
With respect to EBS pollock stock status, the spawning biomass in 2008 was at the lowest level since 1980, but has increased by 43% since then, and further increases are projected for the next few years. The 2008 low was the result of below-average recruitment from the 2002-05 year classes. Recent and projected increases are due to above-average 2006 and 2008 year classes. Spawning biomass is projected to be 17% and 26% above Bmsy in 2012 and 2013, respectively.
For ABC, setting the recommendations for 2012 and 2013 were below their respective maximum permissible levels; specifically, at values corresponding to the average harvest rate over the most recent five complete years (0.30). Poor fishing conditions observed by the fleet (on average) after the beginning of August 2011 through to the end of the season became an important consideration during plan team, SSC, and Council deliberations. It was noted, however, that pollock schooling behavior appeared different than in other years and that the dispersion onto broader areas of the EBS shelf may in part explain the poorer fishery catch rates. BSAI Pacific cod: Considerable effort to respond to the public and the Council comments on the Pacific cod assessment continued in 2011 with meetings in May, September-October, and November-December. The accuracy of age readings for this stock has been a continuing concern, mainly because the mean size at age from age readings did not match the first three clear modes of cod length frequencies in the Bering Sea trawl survey. Other issues have been the trawl survey catchability coefficient, the modeling of commercial selectivity (variable or not, asymptotic or not, fishery by fishery), and the modeling of growth (constant, cohort-specific, year-specific).
In 2011 there was a CIE review which also contributed to suggestions for model and assessment refinements. The range of models explored produced similar fits to the survey abundance data and similar estimates of historical recruitment and present abundance. All models predicted mean length at age of younger fish in good agreement with the modes in the trawl survey length frequencies. The selected model fit the survey age data best in most years. Survey data indicate that after all-time lows from 2006 through 2008, the 2009 Bering Sea survey biomass for Pacific cod was slightly higher than the 2008 estimate, and the 2011 biomass estimate was 4% higher than the 2010 estimate (which was more than double the 2009 estimate).
The 2006 and 2008 year classes appear to be strong, and stock abundance is expected to increase substantially in the near term. The Pacific cod ABC for 2012 increased by 34% relative to the 2011 value, to 314,000 t. The projected spawning biomass in 2012 is 410,000 t or about 46% of the estimated unfished stock size. The SSC has recommended that the stock be managed under a combined BSAI OFL and separate BS and AI ABCs sometime in the near future (presently both specifications are for BSAI combined). BSAI yellowfin sole: The 2011 EBS bottom trawl survey biomass estimate was within 1% of the 2010 survey value, and updated model results indicate stock condition that is about the same as in 2010. This was despite a model change in the estimated average weight at age used. The stock assessment model indicates that yellowfin sole have slowly declined since the early 1990s, although they are still at a fairly high level (74% above Bmsy). The projected female spawning biomass estimate for 2012 is 593,000 t and suggests a reversal of the generally monotonic decline in spawning biomass that has prevailed since 1994. This upward trend in the population may be expected due to apparent high recruitment from the 2003 year class. BSAI northern rock sole: The stock assessment model estimates a 2012 age-2+ biomass estimate of 1,860,000 t, which is equal to the 2011 value projected in last years assessment. The stock is expected to increase because of recruitment from the 200005 year classes, all of which were stronger than any year class spawned between 1991 and 1999. Spawning biomass for 2012 is projected to be at more than two times Bmsy and the 2012 ABC is 208,000 t. The stock is stable and lightly exploited primarily because it is constrained by prohibited species catch limits (i.e., Pacific halibut). BSAI flathead sole: Model estimated spawning biomass has declined from a high of 328,000 t in 1997 to a low of 243,000 t in 2009, increasing slightly to 247,000 t for 2011 with projections for 2012 of 250,000 t. These slight increases are consistent with increases in 2012 ABC (70.4 thousand t) relative to the 2011 estimate (69.3 thousand t). The 200103 year classes are estimated to be above the 19942008 average, but recruitments from 19942008 on average have been much lower than recruitments from 197489. BSAI Alaska plaice: This resource continues to be estimated at a high and stable level with very light exploitation. The 2011 model biomass (age 3+) dropped from the 2010 estimate due to a modification in the assumption of survey catchability. Exploitation occurs primarily as bycatch in the yellowfin sole fishery and has averaged only 1% from 1975-2011. BSAI Greenland turbot: The 2011 EBS shelf trawl survey biomass estimate was increased again in 2010 after more than doubling the 2009 estimate. It represents the highest biomass since 2003. More significantly, the population numbers were the highest ever recorded (since the standard survey began in 1982). The total 2010 and 2011 population estimate (in numbers, all ages) from the EBS survey was over five times the average for Greenland turbot.
The high numbers were almost entirely due to indications of 1- and 2-year-old Greenland turbot in this survey. Nonetheless, spawning biomass has declined continuously since 1978; projections indicate that it should increase after 2015, as recent cohorts mature. The projected spawning biomass for 2012 is estimated to be at 88% of unfished levels. BSAI Atka mackerel: The projected female spawning biomass for 2012 using the catch levels in the proposed Steller sea lion reasonable and prudent alternatives (Atka mackerel is a key forage species) is 129,000 t, which is 50% of unfished spawning biomass and above B40% (102,000 t). The 2012 estimate of spawning biomass is down 12% from last years estimate for 2011 (146,000 t).
The projected age 3+ biomass at the beginning of 2012 is 405,000 t, down slightly (7%) from last years estimate for 2011. Strong cohorts arising from 19982001 and 200607 year classes have caused increased and variable biomass patterns for this stock. Current estimates indicate spawning biomass reached an all-time high in 2005, then decreased until a slight upturn in 201011, with further decreases projected through 2014.