In the GOA, assessments for 24 stocks or stock groups were completed. Since new primary groundfish survey data were available, full assessments were presented for all stocks.
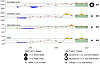
A brief overview of the GOA survey trends by region (all groundfish species combined) indicates increases in all areas since the 1980s but relative stable conditions since the 2007 survey (past 5 years; Fig. 1).
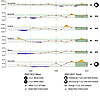
By broad species groups, the GOA survey trends (region-wide) reflect similar increases except for roundfish (pollock, sablefish, and Pacific cod) which shows a decline in the early 2000s and a recent increase since the 2007 survey (Fig. 2).
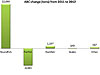
These survey estimates, as moderated by models for many of the stocks, translate to similar changes in 2012-projected ABCs for the species categories relative to 2011 (Fig. 3).
The sum of the recommended ABCs for 2012 is 606,048 t, which represents a 3% increase from the 2011 total. The largest contributor to this increase was due to improved stock conditions for Pacific cod and pollock:
ABC (t)
Species
2011 catch (t)
2011
2012
Change
Pollock
79,805
96,215
116,444
up 20,229
(21%)
Pacific cod
58,836
86,800
87,600
up 800
(1%)
Sablefish
11,057
11,290
12,960
up 1,670
(15%)
Flatfish
9,929
121,245
112,828
down 8,417
(-7%)
Arrowtooth flounder
29,703
213,150
212,882
down 268
(0%)
Rockfish
22,650
34,653
35,850
up 1,197
(3%)
Atka mackerel
1,613
4,700
4,700
same
(0%)
Skates
4,016
8,273
8,422
up 149
(2%)
Other species
2,135
13,795
14,362
up 567
(4%)
Total
219,744
590,121
606,048
up 15,927
(3%)
Units are metric tons.
For most stocks, the Council established TACs equal to ABCs with some exceptions. These exceptions include Pacific cod, where the quota was reduced approximately 24% to account for removals in the state-managed fishery, and those fisheries where the bycatch of other target species is a concern, specifically for shallow water flatfish (Western and Central GOA); flathead sole (W and C GOA); arrowtooth flounder (GOA-wide); and other slope rockfish (East Yakutat/Southeast Outside). For those fisheries, the TAC was set below the ABC. Atka mackerel was also established at levels to meet incidental catch needs in other fisheries only (no directed fishing is allowed). Brief summaries of the full assessments for the GOA species or species group follow. GOA Pollock: The 2011 summer bottom trawl survey indicated a similar biomass compared to the 2009 survey (about 670 thousand t) whereas the Alaska Department of Fish and Game (ADF&G) survey (nearer shore) suggested a decline from the previous 2 years but above the near-term mean. New in 2011 was the attempt to conduct an acoustic trawl survey of GOA resources (including pollock as the principal species). Due to some unfortunate conditions and equipment failures, the summer acoustic trawl survey only covered about 75% of the area that had been planned. Model estimated abundance of mature fish in 2012 is projected to be 11% higher than in 2011, and is projected to increase gradually over the next 5 years. The model estimate of spawning biomass in 2012 is 228 thousand t (about 34% of the unfished spawning biomass estimate). A Center for Independent Experts (CIE) review of the pollock assessment is scheduled for 2012. GOA Pacific cod: The 2011 NMFS bottom trawl survey estimate was just over 0.5 million t, which is about 21% higher than the mean survey estimate from 1984 to 2011. A sequence of models was evaluated which considered alternatives for growth specifications, inclusion of age composition data, and survey variability treatments. The model selected for management purposes projected the spawning biomass estimate in 2012 is 121,000 t (about 46% of the estimated unfished stock size). Near-term estimates indicate the spawning stock will increase in 2013, stabilize, then decline after 2015, given projected catches. GOA/BSAI Sablefish: The sablefish fishery abundance index was down 9% from 2009 to 2010 (the 2011 data are unavailable) but the survey abundance index increased 3% from 2010 to 2011 following a 10% increase from 2009 to 2010. There are signs of incoming recruitment based on longline survey data. Research on depredation issues with both killer whales and sperm whales continues. Sablefish spawning biomass has increased from a low of 30% of unfished biomass in 2002 to 37% projected for 2012. GOA Flatfish: REFM scientists completed six flatfish assessments including a new multi-species, split-sex, length-based model of northern and southern rock sole. The Council used this new assessment to establish the stock as qualifying for Tier 3 (under the NPFMC Fishery Management Plan (FMP) rules. Importantly, this satisfied one of the MSC certification conditions set for this fishery (which was certified by their ecolabeling program in June 2010 and includes flathead sole, arrowtooth flounder, and rex sole). These stocks are all well above their target stock size and catches are typically on the order of 10% of the ABCs; nonetheless, a number of ABCs declined relative to the 2011 values:
ABC (t)
Species
2011
2012
Change
Shallow water flatfish
56,242
50,683
down 5,559
(-10%)
Deep water flatfish
6,305
5,126
down 1,179
(-19%)
Rex sole
9,565
9,612
up 47
(0%)
Flathead sole
49,133
47,407
down 1,726
(-4%)
Arrowtooth flounder
213,150
212,882
down 268
(0%)
Subtotal
334,395
325,710
down 8,685
(-3%)
GOA Rockfish: Scientists with the Auke Bay Laboratories MESA program completed eight full stock assessment chapters for rockfish in 2011. The northern and pelagic shelf rockfish assessments models were modified with dusky rockfish replacing "pelagic shelf rockfish" as a chapter on its own (yellowtail and widow rockfish were combined with the other slope rockfish complex and renamed simply "Gulf of Alaska other rockfish"). The largest rockfish stock in the GOA is Pacific ocean perch, which was virtually unchanged in ABC recommendations relative to 2011. Trends in other stocks (in particular northern rockfish and shortraker rockfish) were up relative to 2011 giving rockfish as a group a 3% increase relative to 2011:
ABC (t)
Species
2011
2012
Change
Pacific ocean perch
16,997
16,918
down 79
(0%)
Northern rockfish
4,854
5,507
up 653
(13%)
Shortraker
914
1,081
up 167
(18%)
Dusky (Pelagic shelf)
4,754
5,118
up 364
(8%)
Rougheye/blackspotted
1,312
1,223
down 89
(-7%)
Demersal shelf rockfish
300
293
down 7
(-2%)
Thornyhead rockfish
1,770
1,665
down 105
(-6%)
Other rockfish
3,752
4,045
up 293
(8%)
Total
34,653
35,850
up 1,197
(3%)
GOA Skates: This stock complex is managed as split into three groups for ABCs: big skate, longnose skate, and other skates (mostly Bathyraja spp). The biomass (and ABC) breakout is roughly 45:30:25; respectively, for these species and species groups. The trend is up slightly for big skates and stable for the others. The fishery and incidental catches in other fisheries have been about two-thirds of the TAC for big skates and less than half for longnose and "other" skates. GOA Sculpins: The sculpin complex ABC determination is linked to the survey biomass and estimate of natural mortality. Recent catches of sculpins are well below the ABC established for the sculpin complex (beginning in 2011; prior to this they were managed as part of the "other species" group). Based on survey results, the stock status trend indicates a 4% increase over 2010 estimates.