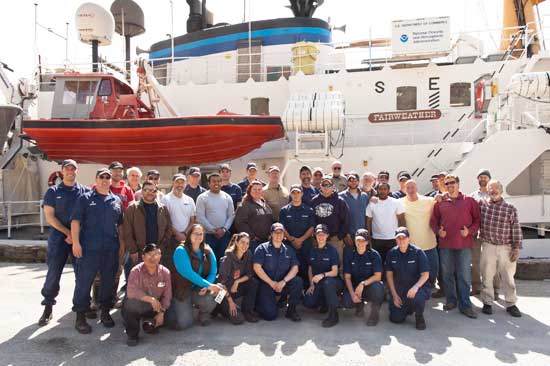
Figure 11. Members of the 2012 FISHPAC field party.
Three branches of NOAA are working together as part of the FISHPAC project to coordinate fish-habitat research and nautical charting in the eastern Bering Sea (EBS). Both efforts require quantitative environmental observations about the seafloor over sizable geographic areas and use innovative technology and efficient methods to acquire data. The AFSC Habitat Research Group (HRG) is building basin-scale numerical models to explain the distribution and abundance of EBS species. The resulting quantitative relationships not only satisfy the Congressional mandate to identify and describe essential fish habitats (EFH), but also can be used to gauge the effects of anthropogenic disturbances on EFH, improve fish-stock assessments, and predict the redistribution of species into northern waters as a result of environmental change. The NOAA’s Pacific Hydrographic Branch is responsible for hydrographic surveys and nautical charting to ensure safe, efficient, and environmentally sound marine transportation in Alaskan waters. Activities between these two groups are facilitated by a NOAA Corps hydrographer assigned to the HRG.
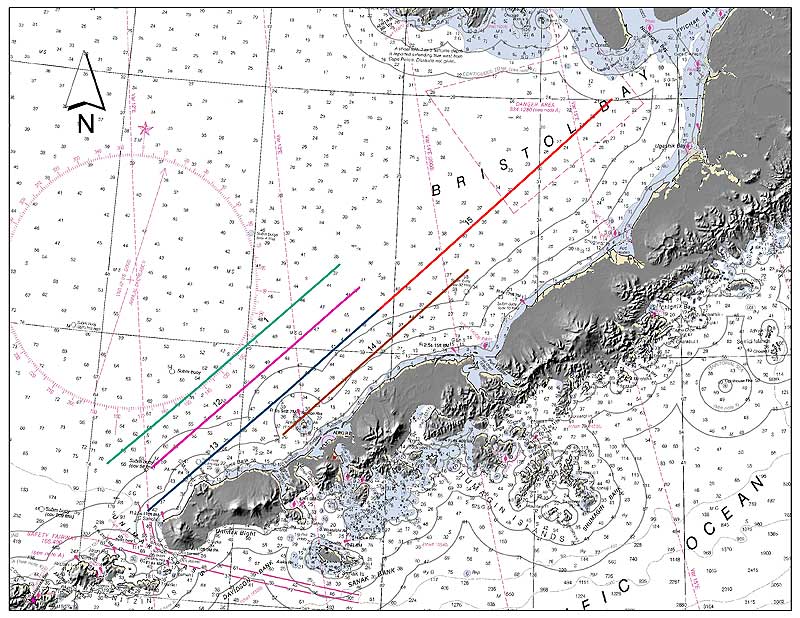
Figure 12. Survey tracklines for the multi-mission 2012 FISHPAC cruise in the eastern Bering Sea. Click image to enlarge.
A major multi-mission research cruise was conducted in the EBS in 2012, involving a 12-member team of HRG scientists, Navy technicians, and a consulting engineer (Fig. 11). The primary purpose of the cruise was to investigate whether seafloor backscatter data can be used to improve EFH descriptions. Although largely a scientific study, the FISHPAC project also collected hydrographic-quality bathymetric data to update nautical charts of areas with outdated or non-existent information. The study area consisted of five 115-145 nautical mile tracklines across the EBS shelf over depths ranging from 37 to 126 meters (Fig. 12). These survey lines were chosen to pass directly over 26 RACE bottom-trawl-survey stations at which a wide range of fish and invertebrate abundances has been observed. Over the period 12-28 July, each line was navigated three times with continuous shipboard operations. On every pass, backscatter and bathymetry were collected using the ship’s two multibeam sonars (Reson models 7111 operating at 100 kHz and 8160 at 50 kHz). Three other sonars were utilized on the first and third passes over the lines, including a conventional side scan sonar (Klein 5410, 455 kHz) and a prototype long-range side scan sonar (Klein 7180, 180 kHz) with an independent single-beam echosounder mounted on the towfish (Elac Nautik, 38 kHz).
Following a review of side scan imagery, geological and biological sampling was conducted on the second passes over the lines and constituted groundtruthing of the sonar data. Two sediment grabs and digital still photos were collected at 4-6 points on each trackline. One of these grabs will be used for a laboratory analysis of sediment properties, and the other will be processed to characterize invertebrate organisms living in the substrate.
Geophysical properties of the seabed as well as sound velocities in the water column were measured at each groundtruthing location, and elsewhere as needed, using a free-fall cone penetrometer. Occasional conductivity-temperature-depth (CTD) casts provided additional sound-velocity data to ensure high quality hydrographic products. Subsea positions for all instruments were determined with an ultra-short baseline positioning system that interfaced with the ship’s navigational system. After nearly 3,800 GB (3.7 terabytes) of data are processed, statistical analyses will identify the most cost-effective sonar system. The best performing system will be used to map and characterize the seabed of the EBS shelf and to update EFH descriptions for all affected species. These same acoustic data may also be useful for stock assessment purposes, if survey trawl performance (catchability) is related to seafloor characteristics.