Status of Stocks & Multispecies Assessment Program
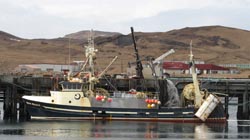
Figure 1. At port in Adak, Alaska, the F/V Muir Milach, a 32-m stern trawler was used to conduct the 2006 Aleutian Islands cooperative acoustic survey study.
2006 Aleutian Islands Cooperative Acoustic Survey Study
The Aleutian Islands Cooperative Acoustic Survey Study (AICASS) conducted a feasibility study in February-April 2006 to assess using a small (<35 m) commercial fishing vessel to estimate the abundance of walleye pollock (Theragra chalcogramma) in waters off the central Aleutian Islands. NMFS currently has limited resources to conduct acoustic surveys of pollock in the Aleutian Islands subarea.
The acoustic and biological information from the study is being used to assess: 1) if it is feasible to conduct acoustic surveys in the Aleutian Islands using commercial fishing vessels, 2) if the data collected are of sufficient quality for management purposes, and 3) the extent that fine scale spatial and temporal management measures may be biologically reasonable. The project was envisioned as a first step in the development of a comanagement/comonitoring system that would involve the Aleut Corporation (the local Alaskan native corporation that has been allocated the pollock quota for this area), local fishermen, and NMFS. This could potentially lead to limited pollock harvests that explicitly accounts for the needs of Steller sea lion (Eumetopias jubatus) within critical habitat.
The project was conducted aboard the fishing vessel Muir Milach, a
32-m stern trawler (Fig. 1) in three activity phases:
1) evaluating the commercial fishing vessels appropriateness as an acoustic
sampling platform; 2) opportunistically collecting acoustic data of pollock
distribution around two sites, Kanaga Sound and Atka Island (Fig.
2 and Fig.
3) direct acoustic and biological data sampling at one of the study sites.
To verify the acoustic data and to support the study, 1,000 metric tons (t)
of pollock was allocated to beharvested within an area that included waters
within 20 nautical miles (nmi) to 3 nmi of Steller sea lion haulouts.
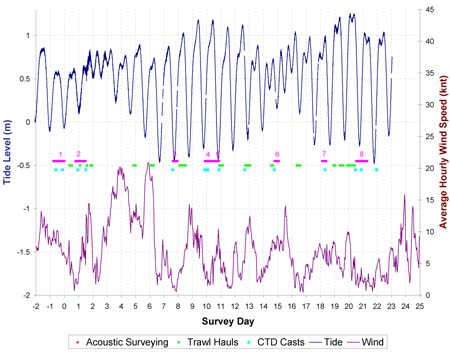
Figure 3. Weather and tide fluctuations relative to survey activities. Wind speed and tide data from Adak, Alaska, station ADKA2 9461380 (NOAA 2006).
A SONAR-self noise test was conducted on 15 February 2006 to assess the noise characteristics of the vessel and determine the optimum vessel speed for conducting the survey. An engine speed of 1,200 rpm was determined to be optimal for acoustic surveying resulting in a survey speed between 6 and 8 knots and a signal-to-noise ratio of at least 10:1. The acoustic system calibration followed standard sphere calibration protocols and were conducted prior to and post study to ensure system reliability. Sphere calibration showed that the system was stable during the duration of the survey. These tests, therefore, allowed us to conclude that the acoustic data from the Muir Milach were of sufficient quality for abundance estimation.
Opportunistic acoustic data were collected by the Muir Milach within two proposed study sites during the Pacific cod (Gadus macrocephalus) fishing season in February 2006. In consultation with the fishing vessel captain and upon review of the opportunistic acoustic data, a survey area inside the Atka Island study site, east of North Cape, Atka Island and west of Kasatochi Island, was selected because the area had the highest observed densities of pollock and had less area closed to fishing due to proximity to Steller sea lion haulouts.
The primary factor thought to affect the ability to survey from small vessels in the Aleutian Islands in the winter months is the weather. Between 13 March and 6 April 2006 the winds were primarily southerly, between 90° and 270°, and hourly average wind speed ranged from 0.5 kts to 20.9 kts with a median and mean of 5.9 kts and 6.9 kts respectively (Fig. 3). Between 13 March and 6 April, the maximum daily wind gusts exceeded 30 kts for 19 of the 25 days and exceeded 50 kts for 9 of the 25 days. Surveying and commercial fishing were suspended from 16 March through 17 March due to high southeasterly winds with gusts exceeding 50 kts. Although other strong wind events occurred during the survey period, they did not affect the ability of the vessel to fish or conduct surveys.
Table 1. Summary of 2006 AICASS surveys.
Survey
Dates
Survey
Day
Spacing (n.mi.)
Number of Transects
Survey Area (n.mi.2)
2
14-15 Mar.
1
1.5
18
180
4
23-24 Mar.
9
1.5
18
180
5
24 Mar.
10
0.5
7
9
6
28-29 Mar.
14
1.0
12
72
7
1 Apr.
19
1.0
12
72
8
3-4 Apr.
21
1.5
18
180
Of eight acoustic surveys, six were successfully conducted between 14 March and 4 April 2006 (Table 1). The area from North Cape of Atka Island to Koniuji Island (~1 degree longitude) was surveyed three times while a smaller subset of this area was surveyed on three other occasions. The three larger surveys (180 nmi2 with transect spacing at 1.5 nmi) were conducted in the beginning (Survey 2), middle (Survey 4), and end (Survey 8) of the study period. Survey 5 was conducted parallel to the shelf break and covered only 9 nmi2 (with transects spaced at 0.5 nmi). This survey provided data useful for geostatistical analyses. Surveys 6 and 7 covered 72 nmi2 with 1.5 nmi transect and occurred in the middle of the large survey area coincident with the highest density of pollock. All survey transects were designed to sample 5 nmi offshore after the shelf break (181-m isobath) and 1 nmi inshore from the shelf break.
To reduce survey time, an adaptive strategy was implemented, and transects were ended when it was determined that pollock sign was no longer encountered along a transect. Small trawl tows (<10 t) were conducted during the surveys to identify acoustic sign. Between survey periods the vessel was allowed to fish commercially until it reached capacity (~165 t). The catch was then delivered to the Adak Fisheries fish processing plant on Adak Island. Biological samples including length, weight, maturity, otoliths, and fin clips were collected from both the verification and commercial tows. Physical oceanographic data were also collected throughout the survey using a Sea-bird conductivity-temperature-depth (CTD) system.