Figure 4. Collection location of Pacific cod specimens in the eastern Bering Sea. Symbols represent age classes assigned by counting otolith growth zones during initial age determinations.
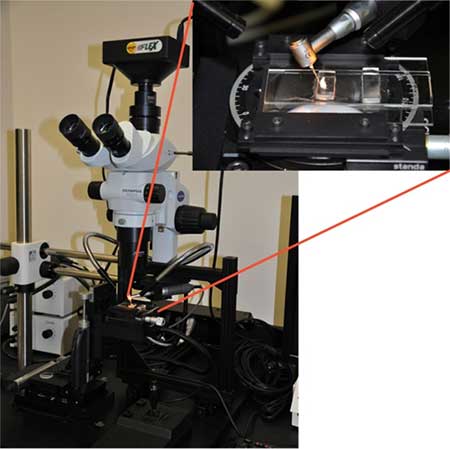
Figure 5. Micromilling system: full Carpenter CM-2 system, and close up of micromilling stage and mounted otolith thin section.
Study Design
We used Pacific cod otoliths collected in the eastern Bering Sea (EBS) during AFSC assessment surveys conducted in 2006-2010 (Fig. 4). Prior to our study, specimens were aged for stock assessments by the break-and-bake method, the standard Pacific cod age determination method used at the AFSC. In this ageing method, otoliths are cut with a diamond saw transversely through the core and toasted in a small oven for about 5 minutes at about 400ᵒF. This preparation increased the contrast of translucent zones, dark zones thought to be deposited when winter temperatures are lowest, which were then counted. In the present study, the specimens were aged again independently by three additional age readers from the Age and Growth Program, resulting in a total of four sets of independent ages. On images photographed with a high resolution microscopy system, all readers recorded the location of each translucent growth zone they counted. We used Pacific cod 2 to 5 years of age due to the uncertainty of assigning ages to younger animals, and more specifically due to the mismatch between the mean size at age and modal length frequency progression. We randomly selected 40 Pacific cod specimens, each initially aged 2 to 5 years old, from the 2006-2010 surveys. Ten otoliths were taken from each age class, representing the 2004 and 2005 cohorts. This selection process based on age and cohort allowed us to evaluate age determination bias by estimated age.
To generate a δ18O signature representing the life of each fish, careful microscopic and analytical procedures were necessary, requiring specialized high-resolution sequential microsampling and stable isotope mass spectrometry tuned to small sample mass. Prior to sampling for isotopic analysis, the remaining intact otolith of each pair was thin-sectioned by embedding it in plastic resin and making two transverse cuts with a diamond saw. The resulting thin sections were mounted on glass slides and polished to a thickness of 0.7 mm (Fig 3). Images of the thin sections were annotated to show the specific growth zones counted most recently by the three age readers. This required that locations of the earlier counted growth zones in the break-and-bake preparations were translated to the new thin-section images. Next, to carry out the high-resolution sequential microsampling, we used a Carpenter Systems CM-2® micromilling instrument. This computer-controlled system (Fig. 5) allowed progressive sampling which started at the inner most area of the thin section and advanced to the otolith’s edge (Fig. 6). Each progressive milling was about 40 µm wide, 900 μm long, and 250 µm deep and produced calcium carbonate powder with an average mass of about 30 µg. The micromilling provided up to 45 samples in any single otolith and up to 9 samples per postulated year. In collaboration with scientists in the College of Earth, Ocean, and Atmospheric Sciences at Oregon State University, the oxygen isotopic composition of the milled calcium carbonate powder was analyzed by dual-inlet mass spectrometry using a Kiel III carbonate preparation system connected to a MAT 252 mass spectrometer. Results were reported in standard delta notation (δ18O ‰) relative to Vienna Pee Dee Belemnite (VPDB) (see Fig. 7).
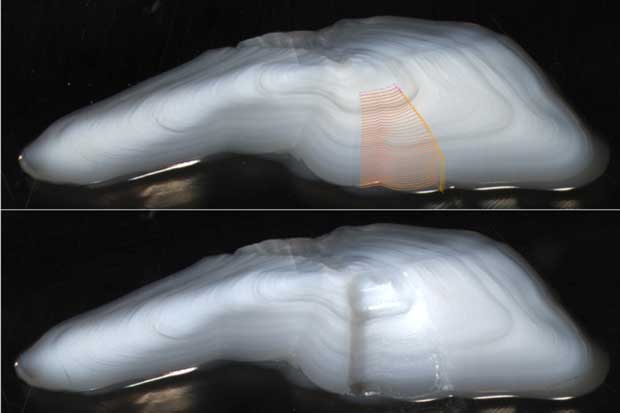
Figure 6. Transverse thin section of an otolith from a Pacific cod. Top panel shows individual sampling paths (n=37) prior to micromilling. Each path has a width of about 40 μm. Lower panel shows the resulting trough after all samples have been milled.
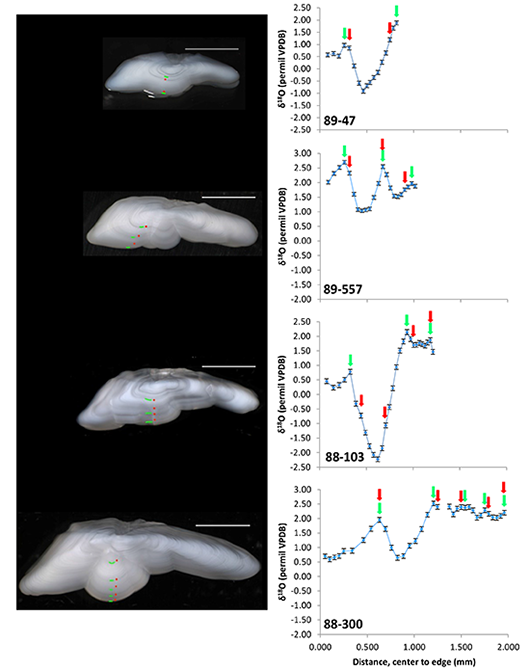
Age validation requires comparisons of “true age” to the age estimated by the standard protocol of otolith growth zone interpretation and counting. To derive a true age, the δ18O signature of each otolith was first plotted sequentially by distance from the center of the thin-sectioned otolith to its edge. Next, the true age was determined by counting the periodic maxima in the sequence of δ18O measurements over the entire life span. Not entirely unexpected, some subjective interpretation of the δ18O results was necessary to define the periodic maxima. In doing so, the main considerations were 1) the variability (2 standard deviation (SD) error bars) of the δ18O data and whether the adjacent valleys and peaks were reasonably dissimilar (Fig. 7), and 2) if the peaks and valleys were defined by more than one δ18O data point. An offset between the location of potential annual growth zones and peaks in the isotope data may have existed. This is because the actual seasonality of growth zone deposition in the otolith may not have been understood correctly or because the spatial resolution of the milling may not have been high enough to avoid smoothing of the δ18O signal. Next, validation of the Pacific cod age determination methods was performed by comparing the number of δ18O maxima to the number of translucent growth zones originally counted in the break-and-bake otolith half. In total, 160 age estimates (4 independent readings x 40 otoliths) were compared to the true age for age validation and bias estimation.
Figure 7. Images of four Pacific cod otolith thin sections and associated δ18O results. The δ18O is plotted by distance milled, inner samples to outer edge. (Error bars are ± SD.) This demonstrates the correlation between the δ18O signature and the location of counted growth zones in the otolith cross sections. Green arrows (plots) and green lines (images) are the location of δ18O peaks; the red dots (images) and red arrows (plots) are the counted translucent growth zones. The scale bars are 2 mm.
Ageing bias, the difference between the growth-zone age and the true age, was estimated by two methods. Each method treated the age data differently. The first treated this difference as discrete and assumed a multinomial distribution. The second treated the difference as continuous and assumed a normal distribution. We employed both methods because previous studies have often estimated ageing bias and error by the latter method. Both approaches yield similar expressions of ageing bias, which quantify the probability of an age reader assigning an age equal to the true age or to some other age.
Our secondary goal required samples of otoliths paired with instrumental water temperature measurements. We used two sources of otoliths associated with known water temperature: 1) EBS and Gulf of Alaska adult Pacific cod that were collected during an archival (temperature and depth) tag-recapture study, and 2) juvenile (1-year-old) specimens collected in 2010 from the EBS.
In the first case, the otolith thin sections were sampled for δ18O on the edge, corresponding to the most recently deposited material, and paired with temperature measured by the tag. In the second case, the otolith thin sections were again sampled for δ18O on the edge, but for these specimens the temperature was measured at the time of capture by instruments mounted on the trawl survey nets. These sources provided a broad range of measured temperatures and hence the ability to describe its relationship with δ18O in the otolith.