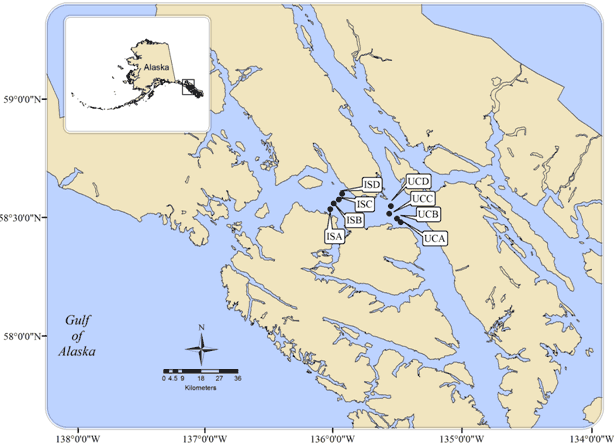
Figure 1. Southeast Alaska Coastal Monitoring survey station locations. Data from ISB was used in our analysis.
Scientists within the AFSC’s Ecosystem Monitoring and Assessment and Marine Ecology Stock Assessment programs are exploring the application of fish and oceanographic survey data to understand variability in the recruitment of sablefish (Anoplopoma fimbria). The data come from the Southeast Alaska Coastal Monitoring project, which is conducted annually (1999 to present) within inside waters of northern Southeast Alaska (Fig. 1), an important pelagic rearing habitat shared by juvenile (age-0) salmon and young sablefish (age-0 to age-2).
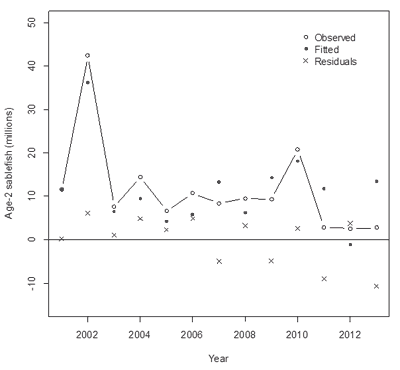
Figure 2. Observed, fitted, and residuals of the joint linear regression model describing age-2 sablefish abundance as a function of chlorophyll a and sea temperature (R2 = 0.77; p-value = 0.00009).
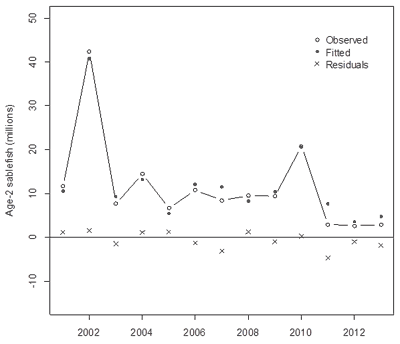
Figure 3. Observed, fitted, and residuals of the joint linear regression and time series error model describing age-2 sablefish abundance as a function of chlorophyll a, sea temperature, juvenile pink salmon abundance index during the age-0 life stage of sablefish, and a 2nd order autoregression process (R2 = 0.97; p-value = 0.00001).
In a linear regression model, the stock assessment estimates of age-2 sablefish abundance were described as a function of sea temperature and chlorophyll during the age-0 stage of sablefish (Fig. 2). Chlorophyll was the strongest predictor of sablefish recruitment (R2 = 0.77; p-value = 0.00009). High chlorophyll values in 2000 and 2008 were associated with high recruitment of age-2 sablefish in 2002 and 2010. Sea temperature explained an additional 9% (R2 = 0.86; p-value = 0.0003) of the variation in age-2 sablefish recruitment.
Residuals of the model had a strong alternating year pattern that may be due to an interaction with pink salmon, which have a 2 year life cycle and are present as juveniles in large numbers in even years along with sablefish.
The addition of a juvenile pink salmon abundance index and a time series predictor in the model helped explain an additional 9% of the variability in sablefish recruitment (R2 = 0.97; p-value = 0.00001) (Fig. 3). Juvenile pink salmon survival served as a proxy for sablefish survival. In addition, higher primary productivity during late summer may index supplementary food supply prior to winter and increased probability for over-wintering survival.
Proxies are being developed for these early life history conditions (late summer bloom and juvenile salmon survival) in order to lengthen the time series of predictor variables and to conduct model validation.
These findings highlight the application of fisheries oceanography survey data of non-target species to represent conditions experienced by a more elusive species in the region, such as sablefish.