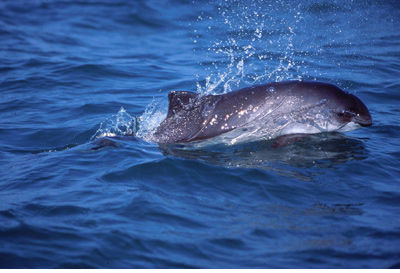
Figure 1. Harbor porpoise. Photo by Ari Friedlaender.
Harbor porpoise (Phocoena phocoena) are known to range throughout Alaskan waters (Fig. 1). Given their wide range of occurrence and distribution in Alaska, we assume that regional populations exist.
Currently, three biological stocks of harbor porpoise have been recognized in Alaska: 1) the Southeast Alaska stock, occurring from the northern border of British Columbia to Cape Suckling, Alaska; 2) the Gulf of Alaska stock, occurring from Cape Suckling to Unimak Pass; and 3) the Bering Sea stock, occurring throughout the Aleutian Islands and all waters north of Unimak Pass. It should be noted, however, that these boundaries were based on very limited scientific information and additional studies are needed to fully examine stock structure for this species.
Harbor porpoise primarily inhabit waters less than 100 m deep. Their preference for shallower waters makes this species vulnerable to being caught incidental to net-fishing operations. The nature and magnitude of incidental takes are unknown but could be significant in some Alaskan salmon (Oncorhynchus spp.) and herring (Clupea pallasi) gillnet and purse-seine fisheries.
In 1991, NMML initiated harbor porpoise studies aboard the NOAA ship John N. Cobb, with survey coverage throughout the inland waters of Southeast Alaska. Between 1991 and 1993, line-transect methodology was used to define overall distribution patterns and seasonality of harbor porpoise, obtain population estimates, and establish a baseline for detecting trends in abundance.
Three surveys, in spring, summer, and fall, were carried out each year by a team of six observers. Annual surveys were continued by NMML between 1994 and 2005; however, only two trips (one in either spring or summer and the other in fall) were conducted per year. Although standard line-transect methodology was not used in these surveys, all observed cetaceans were recorded.
During this 12-year period, observers reported fewer annual encounters with harbor porpoise. Although this raised concerns, our confidence in these data was low due to the lack of standardized effort, different numbers of surveys per year, differences in methodology, differences in survey coverage and duration, variable observer experience, differences in seasonal or yearly porpoise density, and the fact that focal studies were aimed at humpback whales and killer whales.
To update abundance estimates and assess population trends for Southeast Alaska harbor porpoise, NMML, with the assistance of the Alaska Regional Office, initiated line-transect surveys in 2006, 2007, and 2010 using methods comparable to those employed during the early 1990s. In 2006 and 2007, we successfully completed the spring, summer, and fall surveys on the John N. Cobb. Unfortunately, a catastrophic engine failure in 2008 resulted in the decommissioning of this ship; therefore, our summer and fall surveys in 2010 were conducted aboard charter vessels.
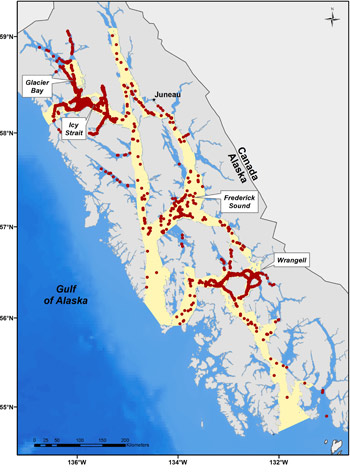
Figure 2. Distribution of harbor porpoise based on NMML line-transect surveys in the inland waters of Southeast Alaska (1991-93, 2006, 2007, and 2010).
Harbor porpoise were seen throughout the inland waters of Southeast Alaska in clumped distributions. Within each year, greater densities of harbor porpoise were observed in the Glacier Bay/Icy Strait region (Fig. 2) and near Zarembo and Wrangell Islands and the adjacent waters of Sumner Strait. These areas of porpoise concentrations persisted throughout the three seasons sampled, although during summer, and to a lesser extent during fall, harbor porpoise occupying the waters near Wrangell Island appeared to expand their movements west into Sumner Strait.
Harbor porpoise mean group size varied by year and by season. Significantly larger groups were seen in fall (1.88 ± 1.12) than in spring (1.56 ± 0.86) or summer (1.61 ± 0.99). Despite the larger fall group size, there was no evidence of seasonality.
Total harbor porpoise abundance in the entire study area was highest in 1991 (1,293; CV=0.15), lowest in 2006 (485; CV=0.17), and equaled 809 animals (CV=0.19) in 2010. The overall abundance estimate does not include a correction factor for perception basis to correct for animals not counted because they were not observed.
Population trends for the whole study area, and for selected sub-areas where higher concentrations have been documented, were assessed from the time series of abundance estimates with a Bayesian exponential model. Results indicated high (65%-99%) probability that the population has decreased in these areas, with an estimated decline of 3.0% per year between 1991 and 2010 for Southeast Alaska inland waters.
Regional trend estimates indicated that harbor porpoise abundance slightly decreased in the Icy Strait and Glacier Bay area, but more pronounced declines were observed in the southern range of the survey area, near Wrangell and Zarembo Islands and in Frederick Sound. The reasons for the negative trends are not well understood and could include fisheries bycatch; changes in prey distribution; a decrease in survival or shift in distribution due to habitat degradation, predation, or disease; or a combination of these factors. It is noteworthy that a greater decline was observed in areas where gillnet and purse-seine fisheries exist.
In 2011, summer and fall surveys were completed. These data are currently being analyzed and will provide NMML with updated abundance and trend estimates for Southeast Alaska harbor porpoise. NMML plans to continue annual surveys in Southeast Alaska to monitor harbor porpoise populations. Additional studies are needed to address harbor porpoise stock structure, dietary preferences, and the cause(s) of the current decline.
By Marilyn Dahlheim, Alex Zerbini, Janice Waite, and Amy Kennedy