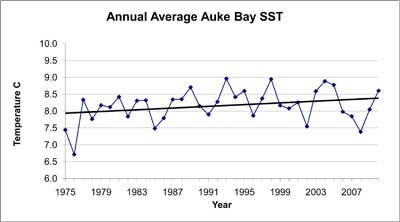
Figure 1. Annual average sea surface temperatures at Auke Bay Marine Station pier, 1975-2010.
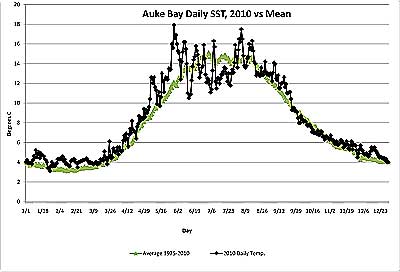
Figure 2. Auke Bay daily sea surface temperature (SST) for 2010 versus the mean.
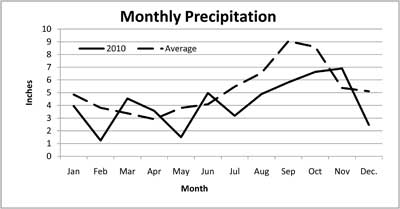
Figure 3. Auke Bay monthly precipitation, 2010 versus the mean.
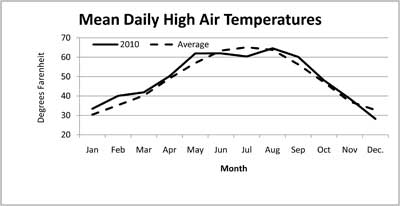
Figure 4. Auke Bay average daily high air temperature for 2010 versus the mean.
Meteorological observations and their summarization in climatological studies are critical for fisheries oceanographers and ecologists. Variations of solar radiation, temperatures, and precipitation drive ocean currents, circulation, and photosynthetic processes which in turn influence the fluctuations of biological populations important to fisheries. Consequently, daily weather observations and the maintenance of these records are important to NOAA’s mission and its several components, National Weather Service (NWS), NOAA Fisheries (NMFS), and National Ocean Service (NOS).
Daily weather observations at the Auke Bay Marine Station were initiated in February 1963 as part of the National Weather Service Cooperative Observer Program. The observations include the daily maximum and minimum air temperature, daily precipitation, daily snowfall, and snow on the ground.
Sea surface temperatures have been included since 1975. Daily observations are taken at the end of the work day at about 16:30 hrs.
Of these parameters, water temperature is a major factor controlling water movements, density, and stratification, as well as the distribution, recruitment, and physiological responses of fish, invertebrates, and plants. After a sequence of colder than average years, the 2010 sea surface temperatures were very close to the 35-year average (Fig. 1).
A series of storms during June and July, accompanied by cloudy days with low solar radiation, broke down the water column stability, thus preventing stratification that would have allowed higher surface temperatures (Fig. 2).
The end result was that despite some exceptionally warm days, June and July had below average sea surface temperatures. The calendar year 2010 was notable for a dry summer and early fall. Overall, 2010 was drier than average (Fig. 3) although the air temperatures were quite close to average (Fig. 4).