Groundfish Assessment Program
The Effect of Autotrawl Systems on the Performance of a Survey Trawl
Three aspects of survey bottom trawl performance 1) trawl geometry (i.e., net spread, door spread, headrope
height) 2) footrope distance off bottom and 3) bridle distance off-bottom were compared among hauls
using either of two autotrawl systems (equal tension and net symmetry) and also with towing cables of equal
length and locked winches.
The effects of environmental conditions, vessel heave, crabbing (vessel heading
offset from vessel course over ground), and bottom current on the trawl performance when using the three
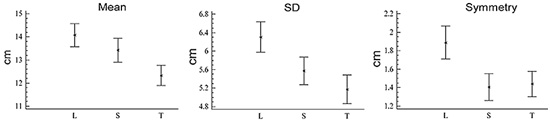
trawling modes were investigated. The means and standard deviations of trawl geometry measures (Fig. 1
below)
were not significantly different between the autotrawl and locked-winch systems. Bottom trawls performed
better when either autotrawl system was used, versus trawling with locked winches, resulting in reduced
variance and increased symmetry of the footrope bottom contact (Fig. 1).
The equal tension autotrawl system
was most effective in counteracting effects of environmental conditions on footrope bottom contact. Footrope
bottom contact was most influenced by environmental conditions while towing with locked winches. Both of the
autotrawl systems also reduced the variance and increased the symmetry of bridle bottom contact.
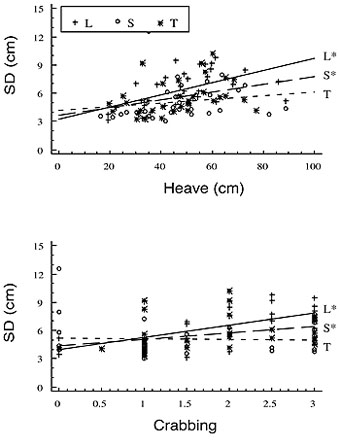
Autotrawl systems proved to be effective at decreasing the effects of environmental factors on some aspects
of trawl performance and, as a result, have the potential to reduce among-haul variance in catchability of
survey trawls (Fig. 2 below). Therefore, by incorporating an autotrawl system into standard survey procedures,
precision of survey estimates of relative abundance may be improved.
By Stan Kotwicki, Kenneth Weinberg, and David Somerton
Figure 1 (above). Means and standard errors of the footrope distance off-bottom,
standard deviation of the footrope distance off-bottom, and footrope symmetry for the locked winches
(L), symmetry (S), and tension (T) treatments.
Figure 2 (right). Comparison of regression lines illustrating the relationship between the standard
deviation (SD) of the footrope distance off-bottom and heave and crabbing for locked winches (L),
symmetry (S), and tension (T) treatments. Treatments in which the environmental variable had a
statistically significant effect on the SD are identified with an asterisk (*).
>>>continued

|

|
Quarterly sidebar
AFSC Quarterly Research Reports Oct-Dec 2004
Contents
Feature
Items
ABL Reports
NMML Reports
RACE Reports
REFM Reports
Quarterly Index
Quarterly Home
|