Groundfish Assessment Program
Estimating Capture Probability of a Survey Bottom Trawl for Bering Sea Skates and Other Fishes
| |
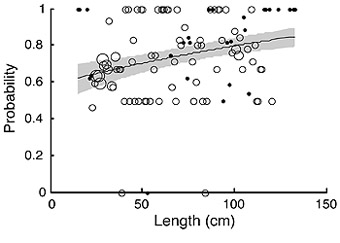
Figure 3. Probability of capture estimated by the parametric model is shown along with 95%
bootstrapped confidence regions. Circles represent observed capture probabilities. Size of the
circle is proportional to number of fish observed in each centimeter length bin.
|
Capture probabilities for skates, three species of flatfish, and seven other species were estimated
for the 83-112 Eastern bottom trawl used to conduct the eastern Bering Sea bottom trawl survey.
Capture
probability data were collected by towing with an experimental trawl that consisted of a standard survey
trawl with an auxiliary net attached beneath the footrope of the survey trawl. It was assumed that the
auxiliary net caught all fish escaping under the survey trawl footrope. Capture probability was then
estimated for each 1 cm of fish length as ratio of fish caught in the survey trawl to the sum of fish
caught in both survey trawl and auxiliary net.
Four competing models describing different capture processes
were fitted to the data using the maximum likelihood method and the best model was chosen by likelihood
ratio test. Capture probability for skates (Bathyraja spp.) increased monotonically with length
from ~ 0.65 for 30-cm skates to ~0.8 for skates > 100 cm (Fig. 3 above).
Capture probability for flatfish
(arrowtooth flounder (Atheresthes stomias), rex sole (Glyptocephalus zachirus), and
Pacific halibut (Hippoglossus stenolepis)), sturgeon poacher (Podothecus acipenserinus),
wattled eelpout (Lycodes palearis), and great sculpin (Myoxocephalus polyancanthocephalus)
was constant across lengths and close to unity > 0.97.
Capture probability was constant, but significantly
lower than 1 for sawback poacher (Leptagonus frenatus) (0.89), searcher (Bathymaster signatus)
(0.94), and spinyhead sculpin (Dasycottus setiger) (0.69). For spectacled sculpin (Triglops scepticus)
capture probability was 1.00 for fish smaller than 15 cm, but decreased for larger fish.
By Stan Kotwicki and Kenneth Weinberg
Effect of Net Spread on Capture Efficiency of a Demersal Survey Trawl Used on the Eastern Bering Sea Shelf
Relative abundance estimates generated from the NMFS annual groundfish trawl surveys in the eastern
Bering Sea shelf are based on mean catch per area swept. In the calculation of these estimates, the
capture efficiency is assumed to be constant with net spread, which increases with depth throughout
the depth range of the survey area and also varies substantially with bottom type and currents. The
validity of this assumption was tested using a linear model of catch-per-unit-towed distance versus
net spread and depth that was fit to 14 years of survey data for seven species.
Catch rates decreased
significantly with increasing net spreads for six of the seven species despite the larger area swept
at greater net spreads. The magnitude of the downward trends varied considerably by species. Purple
sea star (Asterias amurensis) and northern rock sole (Lepidopsetta polyxystra) exhibited
the strongest negative relationships between catch rate and net spread, while Alaska plaice
(Pleuronectes quadrituberculatus) exhibited the weakest relationship.
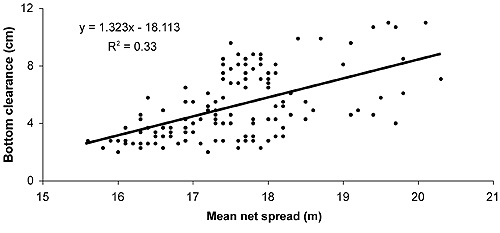
Figure 4. Relationship between mean net spread and the clearance between the footrope and
bottom for the 83-112 Eastern trawl. The clearance increases with increasing net spread, possibly
allowing some fish to escape under the footrope. Data were collected on board the chartered
fishing vessel Arcturus during the NMFS annual eastern Bering Sea demersal trawl survey
in 2004. N=136. |
We attribute this decrease in catch to a decrease in capture efficiency, which is primarily due to
increased escapement under the footrope. Calibrated bottom contact sensors indicate that footrope
clearance with the bottom increases with net spread (Fig. 4 above). The current assumption of constant
capture efficiency at all net spreads may result in biased size distributions and sex ratios for species
displaying size and sex segregation by depth. This assumption may also have negative implications for
the assessment of highly patchily distributed species as well as those whose depth distribution is a
function of changing environmental conditions. Controlling trawl geometry by means of restrictor cables
on the warps is a feasible method to address this problem.
By Paul von Szalay
>>>continued

|

|
Quarterly sidebar
AFSC Quarterly Research Reports Oct-Dec 2004
Contents
Feature
Items
ABL Reports
NMML Reports
RACE Reports
REFM Reports
Quarterly Index
Quarterly Home
|
