
|
| Error processing SSI file |
|
||||
GROUNDFISH ASSESSMENT PROGRAM:
|
||||
|
|
To test this hypothesis, live adult Pacific cod were captured at depths
greater than 90 m with bottom trawls as well as pot gear and held at the
Kodiak Fisheries Research Center's laboratory facility in October and November
2002. Radiographic images are an effective method of highlighting gas-filled
swimbladders in fish. A series of X-rays were taken of 15 individual fish
every other day over a period of 7 days. Each fish was anesthetized with
clove oil, and radiographic images were taken using a mobile veterinary
X-ray unit. Eleven fish were held for 24 hours before the initial X-rays
were taken of the swimbladder. The radiographic images of these fish showed
inflated swimbladders, suggesting that if the swimbladder had sustained
any damage, it had been repaired within the first 24 hours. For the remaining
four fish, initial X-rays were taken 30 minutes after capture. It was
possible to take X-rays of live cod within minutes of capture on the deck
of the fishing vessel because the X-ray unit was portable. Only one of
these four fish (tag nine, 72 cm) showed evidence of a damaged swimbladder
in the radiographic images taken immediately after capture. After 48 hours,
the damaged swimbladder in this fish had increased slightly in size, and
90 hours after capture, the swimbladder had been restored to an expanded
shape (Fig. 2 above). This fish continued to survive in the live tank for another
4 days (168 hours after capture) with a fully inflated swimbladder. The
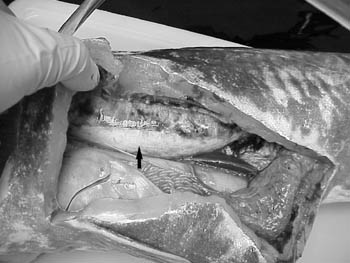
cause of mortality is unknown, but a post-mortem dissection of this fish
showed a fully intact and inflated swimbladder (Fig. 3 below).

Figure 3. Post-mortem of Pacific cod (tag 9) with repaired
and inflated swimbladder. (click image to enlarge)
While the results of the laboratory work may not fully support our hypothesis
explaining the vertical movement behavior of Pacific cod after initial
tagging, one fish did provide evidence of the ability to quickly repair
the swimbladder.
By Liz Chilton and Dan Nichol.
Dover sole (Microstomus pacificus) have a wide distribution throughout the North Pacific, ranging from southern Baja California (lat. 26° to the Gulf of Alaska (lat. 59°N). Prior knowledge of Dover sole reproductive biology was limited to populations at southern latitudes off California and Oregon. Therefore, a study was initiated to determine the length and age at maturity for Dover sole in the Gulf of Alaska.

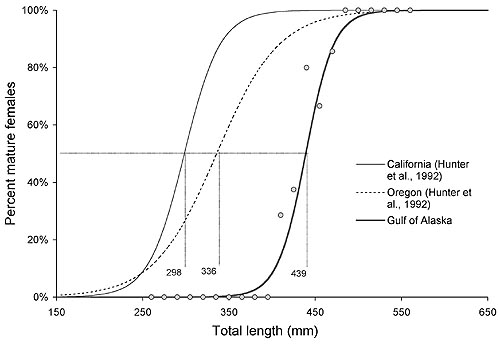
Figure 4. Percentage of female Dover sole that were sexually mature as a
function of total length. Data points along the Gulf of Alaska curve represent
females captured prior to the spawning season (Oct.-Dec.), grouped in 15 mm
length-class intervals. Maturity curves for female Dover sole off the coasts of
California and Oregon are graphed for comparison
Female Dover sole (n = 273) ranging in length from 198 to 663 mm were collected opportunistically around Kodiak Island, Alaska, (latitudes 55°-59°N) between February 2000 and October 2001, with sampling concentrated in February-April, June-July, and October-November. Ovaries were examined to determine the maturity stage using standard histological criteria. The spawning season of Dover sole in the Gulf of Alaska spanned 4 months, from February to May, which is shorter in duration and later in the year than at more southern latitudes. Dover sole in the Gulf of Alaska matured at a larger size than those off California and Oregon, with an estimated length at 50% maturity (ML50) of 439 mm (Fig. 4 above).

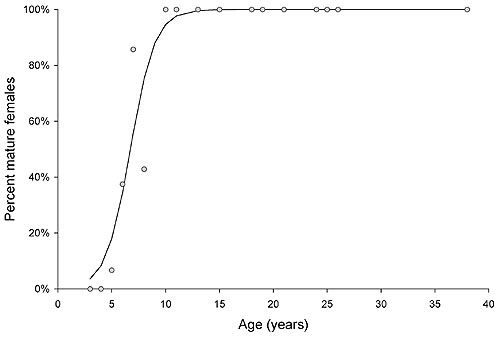
Figure 5. Percentage of female Dover sole in the Gulf of Alaska that were
sexually mature as a function of age.
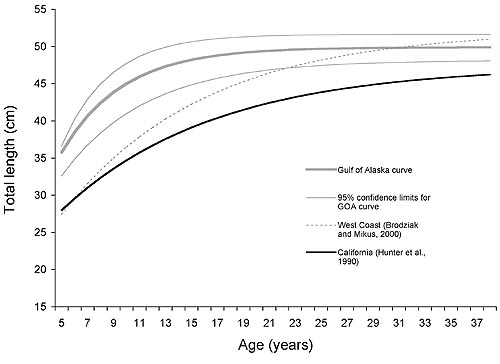
At the same fish length that nearly 100% of Dover sole from California and Oregon waters are mature, Dover sole in the Gulf of Alaska are just beginning to mature. The estimated age at 50% maturity (MA50) for female Dover sole in the Gulf of Alaska was 6.7 years; the minimum age at maturity was 5 years, and nearly all females had reached maturity by age 10 (Fig. 5 above). Dover sole populations at southern latitudes mature at similar ages. We attribute the latitudinal variation in ML50, combined with the similar MA50 across latitudes, to spatial differences in growth rates (Fig. 6 below)

Figure 6. The von Bertalanaffy growth curve, with 95% confidence limits,
for female Dover sole in the Gulf of Alaska. Parameters of the GOA growth model
were L=49.89, k=0.213, and
T=-0.924. Growth curves for female Dover sole off the
coast of central California and the west coast of the United States are graphed
for comparison.
By Alisa Abookire.
![]()
AFSC Quarterly
Research Reports
Oct.-Dec. 2002