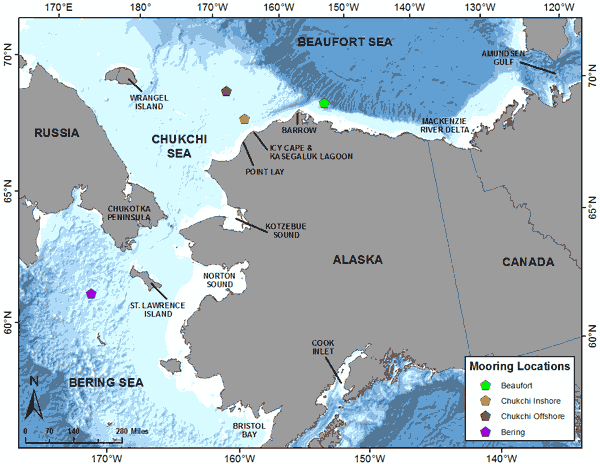
Figure 2. Map of the Alaskan Arctic region, including locations mentioned in the text and each recorder location. Mooring icons cover the approximate call detection range.
Four moorings that included acoustic recorders (AURALs), deployed in autumn 2010 and retrieved the following year, were chosen as representatives for each region (Fig. 2, Table 1). Image files (.png) of spectrograms were pre-generated from recordings, then analyzed using an in-house MATLAB-based program. Data are presented as the percentage of time intervals (standardized to 180 sec) with calls for each day by comparing the number of image files with calls to the number of available image files for each mooring. Data were then averaged using a zero-phase 2-day moving average in MATLAB. The population origin of each peak is inferred using the current understanding of beluga movements from satellite-tagging studies (summarized in Hauser et al. 2014) and aerial surveys (Clarke et al. 1993, 2012; Moore et al. 1993, 2000).
In total, 1,020 days of data were analyzed (~280,000 image files). Due to the recording settings (Table 1), echolocation clicks were not recorded, and all detections were based on beluga social communication signals (whistles, pulsed, noisy, and combined calls). Belugas were detected on 267 days (26% of days analyzed contained one or more beluga calls). Detections were recorded sporadically throughout the region, together with distinct vocal peaks (defined as >20% of time intervals with calls for each day due to the sporadic nature of beluga calls in time, but prolific production per individual) when seasonal migrations transited an area.
In the western Beaufort Sea, two peaks of detections occurred in autumn; the first occurred from 5 to 16 October and the second from 30 October to 2 November. Due to the seasonal timing of detections, the first peak was likely from the EBS stock leaving the Beaufort Sea followed by the ECS stock (second peak; Fig. 3a). A spring peak in detections occurred from 2 until 15 May, with a series of smaller peaks spread from 21 May into the start of June. Both early- and late-May peaks corresponded with similar, slightly earlier peaks in the northeastern Chukchi Sea (Figs. 3a, b). Therefore, the EBS stock, first detected in the northeastern Chukchi Sea (Fig. 3b), continued moving northeast and then east into the western Beaufort Sea in two “groups” en route to the eastern Beaufort Sea (Fig. 3a). Over summer, belugas were detected from 2 July until 22 August and were likely from the ECS stock, as the EBS stock is located in the Canadian Beaufort Sea at this time of year (Fig. 3a). At the inshore, northeastern Chukchi Sea recorder, a strong autumn peak with a high percentage of time intervals with call detections occurred from 19 to 29 November. This peak was likely caused by the ECS stock leaving the northeastern Chukchi Sea (Fig. 3b). Two strong spring peaks with a high percentage of beluga detections were evident; the first spring peak occurred from 23 April to 6 May, and the second spring peak occurred from 18 May to 1 June. Both early- and late-May peaks were likely caused by the EBS stock moving north through the northeastern Chukchi Sea en route to their eastern Beaufort Sea summering grounds (Fig. 3b). On the offshore recorder, the highest percentage of time intervals with calls occurred from 17 November to 1 December. This latter period of detections is consistent with the slightly later movement of the ECS stock out of the northeastern Chukchi Sea (Fig. 3c). No peak in detections occurred in spring on this mooring, but the highest percentage of calls was identified from 11 to 21 April. Due to the seasonal timing of detections, these were likely caused by the EBS stock (Fig. 3c). In the Bering Sea, there was a single peak in detections over winter from 30 December to 1 January, with lower levels of calls detected outside of this peak. This peak was likely caused by the EBS stock, due to their disposition to overwinter in a more southwesterly location than the ECS stock (Fig. 3d). (continued)