As part of the Resource Assessment and Conservation Engineering (RACE) seminar series, Dr. Matt Baker delivered a talk entitled “Synthesis of physical structure and community composition to inform spatial management.” An abstract and select figures from the talk are included below.
Spatial and multispecies management of marine fisheries resources require robust methods to identify regional structure and determine relative impacts of environmental and biological drivers. Building on a recent Bering Sea Integrated Ecosystem Research Program (BSIERP) project, which synthesized expert opinion from oceanographers and biologists to delineate mesoscale heterogeneity in the eastern Bering Sea, we sought to develop an integrated statistical approach to define ecological regions with practical utility towards fishery management. We combined bottom trawl survey data and environmental indices to evaluate shifts in species distributions and abundance over time and space. Applying random forest methods, we quantified the relative influence of physical variables on abundance patterns for individual species and evaluated the relative importance and marginal effect of each physical variable to identify critical thresholds. We then integrated individual species trends to quantify threshold shifts in community composition (multispecies turnover) along environmental gradients. By integrating physical and biological data, we define spatially coherent regions partitioned along ecologically significant gradients. Species interactions are an important a driver of ecosystem functioning and organization. By identifying environmental thresholds for individual species we inform potential competitive and predatory interactions.
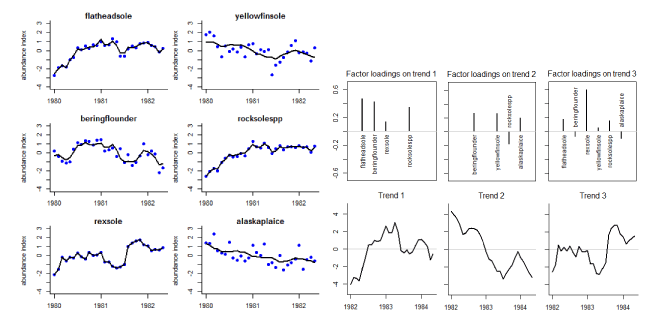
These methods are applied to better inform understanding of potential competitive and predatory interactions and to characterize resource partitioning among species within functional diet-based guilds. Our current research applies these regional boundaries to explore the importance of spatial scale in multispecies autoregressive state-space model outputs. As one approach, we are applying dynamic factor analysis to identify common underlying trends in time series data of species abundance within functional guilds. This research is funded by the Comparative Analysis of Marine Ecosystem Organization and the Habitat Assessment Improvement Plan programs.
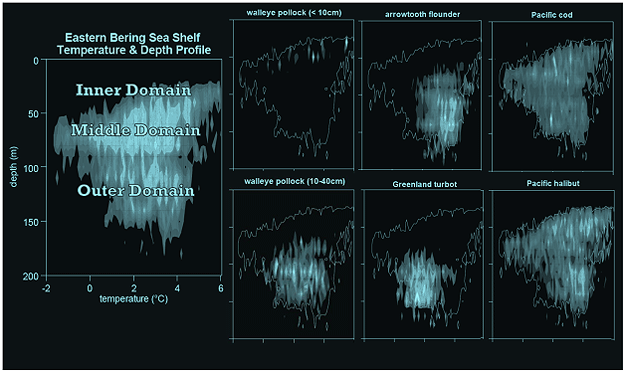
Figure 1. As shown by contour plots, habitat use differs markedly between functional guilds, species, and life stage.
Plots display relative density (biomass) by temperature and depth (lighter areas indicate higher densities). The plot of
the eastern Bering Sea shelf (left) is used to develop a system-wide footprint, superimposed on individual species graphs for reference.
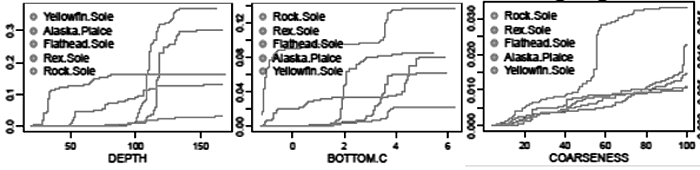
Figure 2. Cumulative importance plots (gradient forest output) display cumulative shifts (in R2 units) of individual species’ abundance across various environmental predictors. The common scale enables comparisons across species within functional guilds (e.g. benthivore flatfishes above).
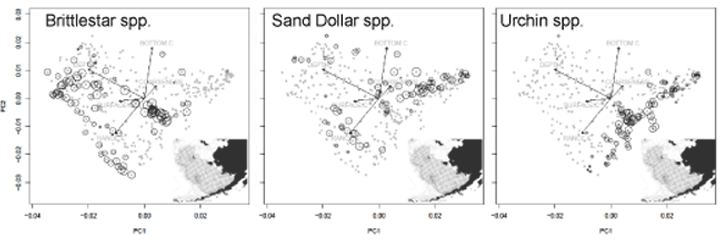
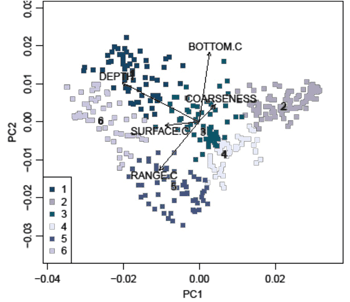
Figure 3. Overlay of weighted species abundance (e.g. echinoderms above) per station in the Bering Sea trawl survey. Coordinate position represents inferred biological composition associated with environmental predictors. Individual points represent sample stations in the survey (inset).
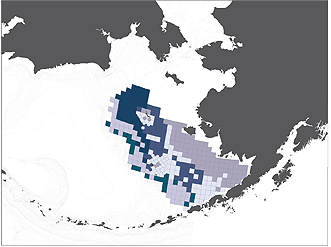
Figure 4. By applying clustering approaches, we are able to group survey stations according to inferred community assemblages (right) and map distinct ecological regions as an output of this analysis (left).
Figure 5. As a next step, we are applying dynamic factor analysis to identify a set of common underlying trends in time series data of species abundance for functional guilds (e.g. benthivore flatfishes above). Models use linear combinations of hidden random walks and compare multiple competing models. Environmental variables can be compared to trend outputs or incorporated directly into model analyses.