Probabilistic Modeling of Northern Fur Seal Movement
In the past 5 years, the Alaska Ecosystems Program (AEP) at the National Marine Mammal Laboratory has conducted several studies of northern fur seals (Callorhinus ursinus) using satellite-telemetry devices, including assessment of pup migration distribution, fine-scale assessment of dive behavior relative to foraging location, and determination of female foraging location relative to diet signatures in stable isotope analysis. All of these studies relied on data collected by satellite-telemetry devices to determine the animals’ locations while away from the rookery.
No matter what the intended use of the collected satellite data, there is often a host of problems that must be overcome to make use of the recorded locations. First, the locations are recorded with error. The current method for determining locations depends on the timing of signals received by a passing satellite. The satellite uses the difference in the timing of received messages to calculate an approximate location. The error in this estimate can range from 150 m up to several kilometers, depending on the number of signals received. Fortunately, these locations can be labeled with a location-quality class that gives an estimate of the error. The second major issue is that location times are often not recorded directly with times of interest (e.g., at times of known diving).
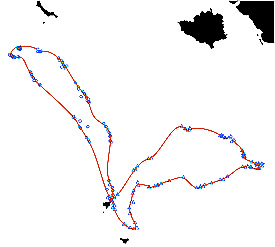
Figure 1. A fitted track with hourly-predicted locations for two female northern fur seals from the Vostochni rookery, St. Paul Island, Alaska; the blue symbols represent the observed locations received by the satellite, and the red tracks are obtained by making hourly predictions and connecting the estimated locations.
In order to overcome these two major issues and make telemetry data more useful, AEP researchers have been developing statistical models capable of accounting for location error, as well as predicting locations for any desired time. Readers who are interested in the mathematical details of these models can refer to the Ecological Society of America Ecology journal article by Johnson et al. (2008) for a more rigorous description. The continuous-time correlated random walk (CTCRW) model works by mathematically describing the velocity of the animal. By describing how the animal’s location changes with time, we can produce a model of locations by essentially summing up the “steps” that the animal takes. Within the mathematical description, we can make the average “steps” depend on parameters measured along with location, such as diving depth, number of dives, or sea-surface temperature. All of these variables might help describe how northern fur seals are foraging relative to their environment.
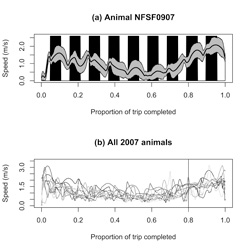
Figure 2. Estimated speed in meters/
second (m/s) for a) a single northern fur seal; and b) a group of northern fur seals; the black bars represent nighttime hours.
Recently we have been developing an add-on package for the freely available R statistical software ( R Core Development Team 2009) to process telemetry locations with the CTCRW model. The package “crawl” was developed by the AEP for the purpose of fitting these models, making location predictions, and simulating possible paths the animal may have taken given the locations that were observed. The software uses the fast Kalman filter to perform the calculations necessary for these operations. To use the software, first R must be installed. Then, one can install the add-on package from within R itself. Both are available from the Comprehensive R Archive Network (CRAN),
Figure 1 illustrates a fitted track with hourly-predicted locations for two female northern fur seals from the Vostochni rookery on St. Paul Island, Alaska. The model fit in this example is just a constant mean velocity. However, one can easily add in time-varying covariates such as time itself. The AEP is currently exploring northern fur seal movement relative to a diurnal cycle. Figure 2 illustrates estimated speed for both a single animal and a group of animals. Changes in speed seem to occur at transitions between night and day. Speed is generally decreasing at dawn hours and increasing at dusk. Because northern fur seals generally forage at night, it seems that foraging is linked with higher rates of travel. This is contradictory to the usual area-restricted search postulated for foraging animals, and AEP researchers are examining whether this is a general pattern.
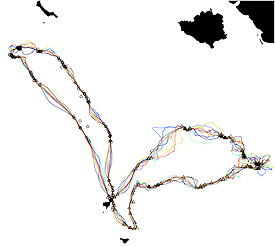
Figure 3. Track simulations for two female northern fur seals from the Vostochni rookery, St. Paul Island, Alaska.
Another aspect of this modeling framework is the ability to simulate a track from the posterior predictive distribution of the animal’s true path. In essence, the crawl package can simulate locations for times when the animal was not located. This is slightly different from making a prediction for the time of interest. The prediction is the single best estimate of location, while the simulated location represents only one possible value. If we model multiple tracks, we can get a sense of the uncertainty in the location estimation. Figure 3 shows track simulations for the same two animals that were illustrated in Figure 1.
In recent months, AEP researchers have been using the posterior predictive simulation to characterize space use of northern fur seals in the Bering Sea. By simulating locations at the time the dives occurred, we are able to estimate dive intensity over the Bering Sea shelf. Figures 4a-c illustrate an estimate of dive intensity for 13 animals that were tagged in October 2007. The visual correction in Figure 4c is accomplished by making pixels more transparent if uncertainty is high. This gives a better overall picture of the spatial dive-intensity estimate.