Status of Stocks & Multispecies Assessment Program
Salmon Bycatch Patterns in the Eastern Bering Sea Pollock Trawl Fisheries
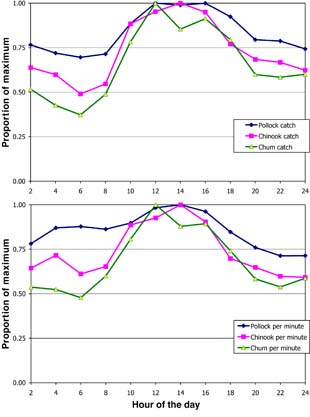
Figure 1. The patterns of pollock and salmon catch (top) and catch per minute (bottom) relative to their daily maxima based on NMFS observer data (1990-2006).
Measures to reduce salmon bycatch have been developed for the NPFMC and incorporated in a number of amendments to the groundfish fishery management plan (FMP). These measures result in specific closed (no-fishing) areas when established bycatch limits are reached. The closure areas were designed based on analyses of groundfish observer data collected from 1990 to 1995. Recently, Chinook and chum salmon bycatch have consistently exceeded the limits which closed large areas and altered the spatial pattern of the pollock fleet.
The effectiveness of this closed-area management action is limited since salmon bycatch rates are spatially variable from year to year. Center scientists are helping evaluate options for the most effective management practices. For example, recent years of spatial and temporal salmon patterns have been evaluated and presented at this years Arctic-Yukon-Kuskokwim Sustainable Salmon Initiative (AYK SSI) symposium held in Anchorage in February.
For the analysis, NMFS observer data were compiled to compare numbers of salmon (categorized as either Chinook or non-Chinook salmon) with pollock catch and to get salmon-specific length frequency data. Chinook salmon are commonly taken incidentally by pollock trawl gear during both A (January-May) and B (June-December) seasons. Chum salmon are primarily taken during the B season. Day-night differences in pollock behavior and catchability are apparent from these data. Both pollock and salmon have somewhat higher catch rates during midday, but salmon rates drop (relatively speaking) more during night (Fig. 1). The nocturnal behavior of salmon, combined with the pollock fishing practices, decreases the relative rate of salmon bycatch. This could be due to diurnal patterns of salmon being more associated with the upper water column at night.
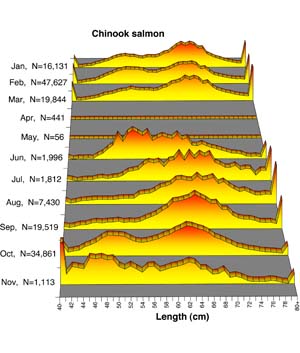
The seasonal size composition of Chinook salmon in the pollock fishery shows two modes, one at about 52 cm and the other at about 66 cm during the winter months with some indication of increasing size within the year (Fig. 2 below). From July to September, the smaller mode is less apparent but does appear again in October at about 49 cm.
Figure 2. Chinook salmon proportions at length by month as taken in the pollock fishery, 1998-2006 combined. Month and sample sizes are shown in the left axis labels.
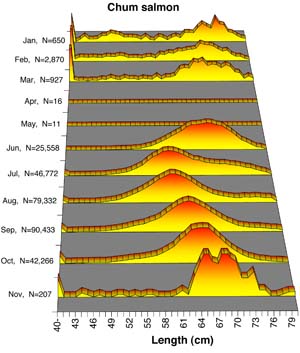
Figure 3. Chum salmon proportions at length by month as taken in the pollock fishery, 1998-2006 combined. Month and sample sizes are shown in the left axis labels.
For chum salmon, the seasonal size composition in the pollock fishery is unimodal, with apparent growth from a mode at about 60 cm in July to 66 cm by October (Fig. 3 above). Length frequencies from other times of year are based on relatively fewer samples and tend to be less than 40 cm. Interestingly, chum salmon from June have a modal value of about 68 cm, substantially larger than the mode of approximately 60 cm observed in July and subsequent months (with obvious growth). This could be due to the fact that in 2006 the highest levels of chum bycatch were recorded in June (presumably this represents the bulk of samples) and that conditions in this year were anomalous. continued