|
|
| Error processing SSI file |
|
||
|
Feature: Part 3
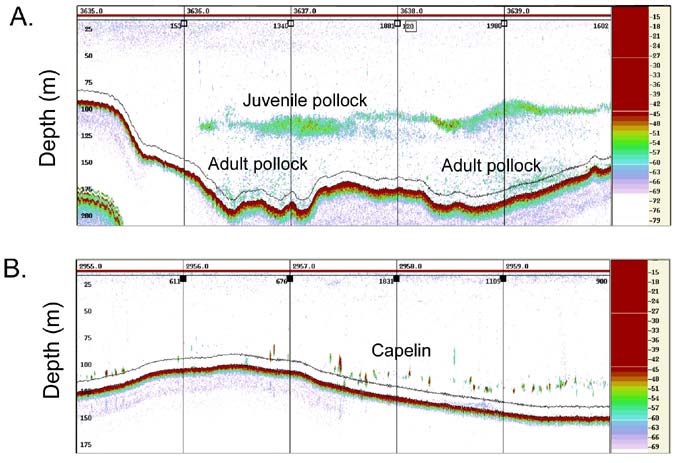
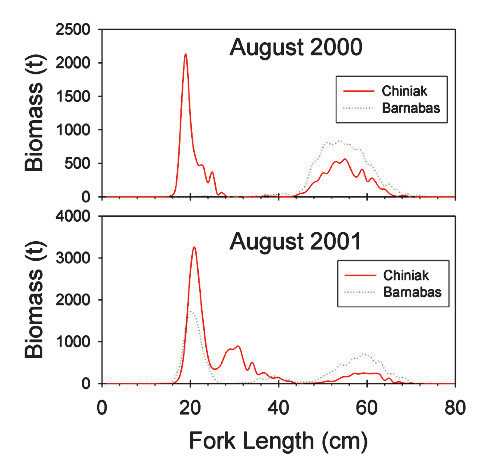
Figure 2. Example echograms illustrating echosign layers attributed to pollock (A) and capelin (B) from the August 2001 fishery interaction study. Data analyses for this work have progressed to the stage where tentative results are available, but final analyses are not yet completed. For this report, estimates of variance for all point estimates are represented by 95% confidence intervals generated using a model-based one-dimensional geostatistical procedure for biomass estimates, bootstrapping methods for fish depth estimates, and traditional sample-based methods for fractal estimates of pollock aggregations. A commercial software package (SonarData Echoview Ltd., Tasmania, Australia) that included patch recognition algorithms was utilized for the identification and analyses of the spatial patterns of the fish aggregations. Patches were identified using objective criteria that remained constant for all survey passes. Efforts are currently under way to extract data for various patch size- and shape-related variables to determine the influence that dynamic mechanisms such as fishing activity levels and biophysical factors have in generating the observed spatial patterns. Fractal measurements of schools, which relate school perimeter to school area, are presented to illustrate one of several potential types of school descriptors that can be used to quantify spatial patterns of pollock and other species. For example, an increase in fractal value, which indicates a more complex school shape, may be indicative of a redistribution process of the fish aggregation (e.g., potential indicator of school disruption into smaller groups). Statistical significance among fractal estimates was based on ANOVA test results. The following preliminary results can be used to illustrate the kind of information that can be gained with this type of approach to fishery interaction experiments. Final conclusions will not be drawn until the 4-year study is completed. The EIT survey for the first year of the study was conducted 8-20 August 2000. Two survey passes were completed in both Chiniak and Barnabas Troughs. Thirty-five hauls were conducted during the first year with the AWT, five with the PNE, and five with the Marinovich net. The EIT survey for the second year of the study was conducted 9-31 August 2001. Three survey passes were conducted in each trough, and a fourth partial pass was also completed in Barnabas Trough over the area where pollock had been encountered during earlier passes. Forty-one hauls were conducted during the second year with the AWT, 16 with the PNE, and 4 with the Methot net. No commercial fishing was allowed in either Barnabas or Chiniak Troughs during survey passes 1-2 in either year. Commercial fishing operations occurred in Barnabas during passes 3-4 in 2001. Acoustic backscattering from unidentified organisms did not prevent the identification of backscattering attributed to pollock and capelin in either Barnabas or Chiniak Troughs in either year (Fig. 2 above). Most of the backscattering was assigned to four types of fish echosign: 1) adult pollock, 2) age-1 pollock , 3) a mix of capelin/age-0 pollock in August 2000 or capelin in August 2001, and 4) other fishes. Classification of the echosign types was difficult and in some cases not possible during darkness when acoustic scattering layers attributed to capelin and juvenile pollock often dispersed and merged to form a single, relatively broad and undifferentiated layer. The deeper adult pollock echosign was generally identifiable during darkness. Figure 3. Pollock size composition estimates for Chiniak and Barnabas Troughs from the August 2000 and August 2001 fishery interaction studies. The size composition of pollock was generally similar between years and troughs although age-1 pollock were largely absent in Barnabas during the first year (Fig. 3 above). Capelin size compositions (not shown) during the second year, when the smaller mesh codend liner was used, were slightly bimodal in Barnabas but not in Chiniak, where generally smaller fish were observed (Chiniak: mean length = 8.5 cm, SD = 1.4, n = 474; Barnabas mean length = 9.6 cm, SD = 1.4, n = 1,389). Because pollock spatial patterns and abundances were estimated both before and during the commercial trawl fishery during the second year of the experiment, it was important to determine the level of fishing activity that was directed at fish in the treatment area. Data have been compiled for 27 of 28 vessels that were fishing in Barnabas Trough during the experiment. These data account for about 99% of the total catch removed from this trough (based on Alaska Department of Fish and Game fish ticket data). The 27 vessels spent about 1,074 hours fishing to complete 167 hauls during 22-31 August (i.e., during Chiniak survey pass 3 (23-26 Aug.) and Barnabas passes 3 (26-29 Aug.) and 4 (29-30 Aug.)). Vessel deliveries during this period indicated that this effort removed nearly 2,850 metric tons (t) of pollock from Barnabas Trough. Based on historical fishing trends, this did not appear to be an unusual level of effort.
|
|
AFSC Quarterly Feature Auke Bay Lab National Marine Mammal Lab RACE Division REFM Division Quarterly Index Quarterly Home |
|
|
||
|
|
||