
|
| Error processing SSI file |
|
||
|
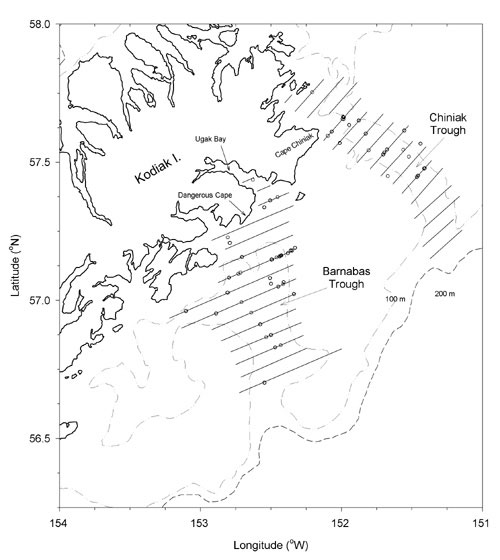
Feature: Part 2  Figure 1. Fishery interaction study area off the east side of Kodiak Island, Alaska, showing survey transects used for all passes during August 2000 and 2001 and trawl locations (open circles) for August 2001. Similar number of trawl hauls were conducted during August 2000. The east side of Kodiak Island in the GOA (Fig. 1 above) was chosen as the study area for the fishery-interaction work for several reasons. Two adjacent submarine troughs with similar topographical features characterized the area. One trough, Barnabas, would serve as a treatment site where commercial fishing was allowed and the other, Chiniak, would serve as a control site where fishing was prohibited. A well established commercial fishery for pollock occurs within the area so that implementation of a fishery “perturbation” during the experiment would be relatively easy. Additionally, the existence of the commercial fishery provided valuable evidence that pollock regularly occurred within the area; this knowledge augmented the limited information from stock assessment surveys. The field-season for the fishery interaction experiment was scheduled for August. This period was chosen because postweaning Steller sea lion juveniles (1 year olds) were considered vulnerable to nutritional stress in late summer and fall due to their high caloric needs per unit body weight and their inexperience at capturing prey. Additionally, fishery management regulations specified an August opening for the commercial pollock fishery in the area which coincided with the timing of the experiment. The study was designed to extend over several years because natural shifts in ocean conditions or variations in the age composition of the pollock stock might influence responses to fishing activities. The survey methods were similar to those used during other routine echo integration-trawl (EIT) surveys conducted by AFSC scientists. Multiple EIT surveys of the control and treatment sites were conducted during daylight hours (ca. 15 hours/day in August) in 2000 and 2001. The surveys consisted of a series of uniformly spaced (3 nmi) parallel transects (Fig.1) to describe patterns in the distribution and abundance of pollock and other selected species over a period of several weeks for each year of the study. A complete sampling of all transects within a trough was considered a survey pass. The number of survey passes differed between years. Two survey passes were conducted within each trough before the fishery in August 2000. No surveys were conducted during or after the fishery in the first year. The work during the first year served two purposes. Because the EIT methods (see below) had not been used in the area during the summer, the suitability of using acoustic methods at that time and location needed testing. For example, the presence of acoustic backscatter from nonpollock scatterers could potentially prevent discrimination of the pollock echosign. Additionally, the natural variability in the temporal and spatial patterns of the pollock distribution and abundance over the 2-4 week field season (in the absence of a fishery) needed to be characterized. Repeated survey passes were conducted during the second year before and during the fishery to investigate whether fishery-induced changes occurred in the fish distribution. A similar number of days elapsed between repeated surveys in each trough during both years. The acoustic data were collected with a calibrated Simrad EK 500 echosounder operating at 38 and 120 kHz. Results in this report were based on the 38 kHz data. Because the acoustic data were only collected to within about 0.5 m of the bottom, it is unlikely that the resulting biomass estimates reflect the total biomass within the troughs. Trawls were conducted during all EIT surveys to identify the species composition of selected echosign and to collect biological samples needed to estimate abundance and distribution patterns. A large midwater Aleutian wing trawl (AWT) and smaller midwater Marinovich trawl were used to target midwater echosign, and a Poly Nor’eastern (PNE) bottom trawl was used to target near-bottom echosign. The codends of the AWT and PNE were fitted with a 32-mm (1 1/4 in) mesh codend liner and the Marinovich with a 3.2-mm (1/8 in) mesh liner except in August 2001, when a 9.5-mm (3/8 in) mesh liner was used in the AWT. A relatively small Methot midwater net with a 1-mm mesh codend liner was used several times during the second year to determine whether some scattering layers consisted of macrozooplankton or micronekton. Each haul was kept to the minimum duration necessary to ensure an adequate sample. Standard catch sorting and biological sampling procedures were used to provide weight and number by species for all hauls. Pollock were further sampled for stomach contents and to determine sex, fork length, age, maturity, and body and ovary weights. Capelin were also sampled for individual body weights and lengths. During the hours of darkness (ca. 9 h/day), transects were resurveyed to characterize diel trends for the dominant species, additional trawls were conducted to identify the species composition of selected echosign, additional conductivity-temperature-depth (CTD) data were collected, and in situ target strength (TS) measurements were made on pollock and capelin. Oceanographic data to characterize the physical environment and its influence on the distribution of pollock and other important species were collected with a trawl-mounted temperature-depth instrument, CTDs, expendable bathythermographs (XBT), and a vessel-mounted thermosalinograph during August 2000. These instruments, as well as five current meter moorings, satellite-tracked drifters, and a vessel-mounted acoustic Doppler current profiler were used during August 2001.
|
|
AFSC Quarterly Feature Auke Bay Lab National Marine Mammal Lab RACE Division REFM Division Quarterly Index Quarterly Home |
|
|
||
|
|
||