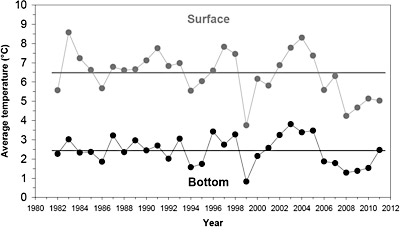
Figure 2. Time series of mean surface and bottom temperatures from the eastern Bering Sea shelf bottom trawl survey since 1982. Horizontal lines represent the mean temperature for years 1982-2010.
Depending on the extent and timing of seasonal ice cover over the eastern Bering Sea shelf, water temperatures can vary widely from year to year (Fig. 2) and have an effect on the distribution of groundfish and crab species.
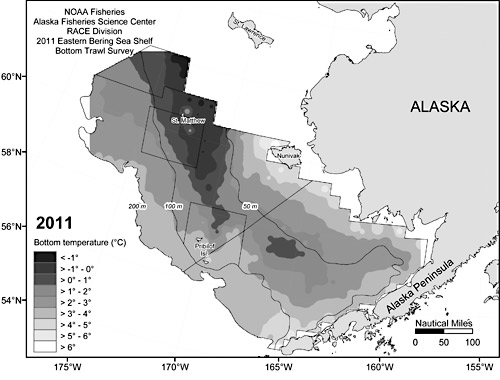
In 2011, scientists found that the mean bottom temperatures for individual stations ranged from -1.6° to 6.5°C and the mean bottom temperature for the entire eastern Bering Sea shelf (2.47°C) increased to a level slightly above the long-term mean bottom temperature (2.44°C) for the first time since 2005 (Fig. 2). The 2011 increase in mean bottom temperature corresponded to a 25%-50% reduction in the area of the cold bottom layer of water (< 2°C) called the "cold pool" compared to the last 5 years (Fig. 3).
Figure 3. Distribution of bottom water temperatures (°C) observed during the 2011 eastern Bering Sea shelf bottom trawl survey.