Resource Ecology & Ecosystem Modeling (REEM) Program
Fish Stomach Collection and Lab Analysis
Laboratory analysis was performed on 786 groundfish stomachs from the eastern Bering Sea and on 185 groundfish stomachs from the Gulf of Alaska. During the eastern Bering Sea (EBS) trawl survey, 2,802 stomachs were collected, and 1,256 stomachs were analyzed at sea. A total of 3,416 stomachs were collected during the later legs of the Gulf of Alaska trawl survey, and 1,494 stomachs were analyzed at sea. Fisheries observers collected 809 stomach samples from the Bering Sea. A total of 2,773 records were added to the groundfish food habits database.
By Troy Buckley, Geoff Lang, and Mei-Sun Yang
Ecosystem Indicators Update
The Ecosystem Considerations report of the Stock Assessment and Fisheries Evaluation (SAFE) Report was presented at the North Pacific Fishery Management Councils September 2007 Plan Team meetings. Many of the physical environmental indices in the Ecosystem Considerations report were updated. For example, the Pacific Decadal Oscillation (PDO), the leading mode of North Pacific sea surface temperature (SST) variability, transitioned from moderately positive in early 2006 to moderately negative in summer/early fall 2006 and has slowly increased to weakly positive values during summer 2007. When the PDO is positive SST anomalies tend to be positive along the North American coast, extending to the southeastern Bering Sea.
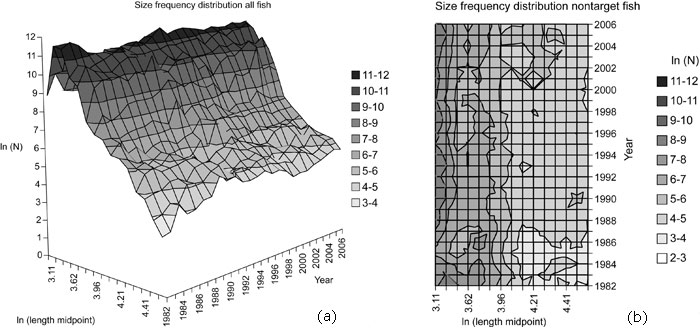
Figure 1. Eastern Bering Sea demersal fish (20-90 cm) community size spectrum (CSS), 1982-2006, for all fish in 3-D (a) and for nontarget fish only in 2-D (b).
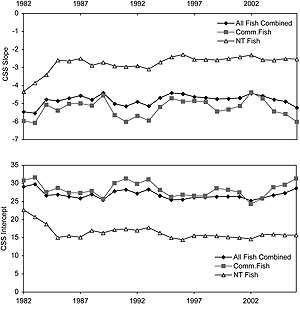
Figure 2. Eastern Bering Sea demersal fish (20-90 cm) community size spectrum (CSS), 1982-2006, changes in slope (a) and intercept (b) of the CSS, 1982 to 2006. NT= nontarget.
The Bering Sea experienced a relatively cold winter and spring in 2007. The presence of sea ice together with below normal ocean temperatures likely resulted in the first ice edge primary production bloom since 1999. Despite the presence of ice in the Bering Sea, there was a record low total area of sea ice in the Arctic in summer 2007. Unlike the northern Bering Sea and Arctic Ocean hot spots, the rate of warming in the southern Bering Sea is slowing down, suggesting a large natural variability component to recent extremes in addition to a background anthropogenic contribution toward warmer temperatures.
Some biological indices were also updated in this draft of the Ecosystem Considerations report. Demersal groundfish species in the Bering Sea-Aleutian Islands region (BSAI) and Gulf of Alaska (GOA), for example, had above-average recruitments from the mid- or late 1970s to the late 1980s, followed by below-average recruitments during most of the 1990s. There is an indication for above-average recruitment from 1994 to 2000 (with the exception of 1996).
In the GOA, recruitment has been below average across stocks since 2001. Annual groundfish surplus production in the EBS and GOA decreased between 1978 and 2005. Declines in production may be a density-dependent response to observed increases in biomass and aging populations of groundfish.
The eastern Bering Sea groundfish community appears to have fewer small individuals and more large individuals through time (Fig. 1a above). The community size spectrum (CSS) slope became less negative and the CSS intercept decreased from 1982 to 1987, primarily due to significant changes in the slopes and intercepts of non-target fish over time (Figs. 1b and 2 above). This would imply that, overall (and particularly for nontarget fish), the groundfish community has fewer small individuals and more large individuals through time. Factors other than fishing, such as the regime shift in 1976/77, may have had an influence on the community size spectrum.
More updates will be provided in the final November 2007 report.