|
Eastern Bering Sea Crab-Groundfish Survey
The Bering Sea Resource Assessment group conducted the annual Eastern Bering
Sea Crab-Groundfish Survey from 29 May to 19 July 2001. Surveys started
earlier in the season for the 1999 and 2000 surveys resulted in having
to resurvey portions of the area for red king crab (Paralithodes camchaticus)
due to the lack of new eggs. This year, thanks to cooperation with the
charter vessels, we were able to conduct gear experiments before the survey
rather than after, and start the survey nearer the historic time of 1 June.
As a result, red king crab egg condition was also near normal, and no
resurvey was necessary.
This year marked the twentieth survey of the standard time series in which
the same gear (83-112 trawl) and the same sampling direction (inner Bristol
Bay to the shelf edge) has been followed. The series consists of 355 planned
stations covering 463,000 km2 (Figure
1). We also marked the fifteenth year
of completing an additional 20 stations in the northwest corner of the
survey to expand the coverage of snow crab (Chionoecetes opilio).
In response to a request from the crab industry we also surveyed another
25 stations during 2001 in the same general area north of the standard
survey area. The need to continue that series will be evaluated. As part
of an effort to improve our estimates of yellowfin sole (Limanda aspera),
we surveyed 19 inshore stations beyond the borders of our regular survey
surrounding Bristol Bay. This is the third year in evaluating that experiment.
Despite the unusual winter of 2001 where no sea ice extended into the southeastern
Bering Sea, the summer bottom temperatures were near the long-term mean
(2001 mean bottom temperature=2.57ºC, long-term mean=2.43ºC). In general,
bottom temperatures were colder than average inshore and along the outer
shelf, while the middle regime between the 50-m and 100-m isobaths was
warmer than average.
The only major species to show a reduction in biomass from the 2000 survey
was walleye pollock (Theragra chalcogramma). This decrease had been predicted
from the stock assessment models run in 2000. The bottom trawl estimate
was 4.1 million metric tons (t). There was no
midwater-acoustic survey
in summer 2001 to evaluate the off-bottom component of the pollock stock.
However, the size composition suggests that incoming year classes may
provide improvement in the near term (Figure 2).
Pacific cod (Gadus macrocephalus) size composition results also indicate
improvement in coming years to go with the significant increase in biomass
in 2001 (Figure 3). The 2001 estimate of abundance is 830,000 t. These
results are particularly welcome after seeing steady declines in cod since
1994.
Other important species showing increases in 2001 include: Alaska plaice (Pleuronectes
quadri-tuberculatus) 538,000 t; Atheresthes sp. 409,000 t; Hippoglossoides sp., 514,000 t; yellowfin sole 1,855,000 t; and northern
rock sole (Lepidopsetta polyxystra) 2,415,000 t.
By Gary Walters.
West Coast Team
Completes Triennial Bottom Trawl Survey of Groundfish Resources
The West Coast Groundfish team completed the 2001 triennial West Coast
bottom trawl survey of groundfish resources between 1 June and 27 August.
Two fishing vessels, Sea Storm and Frosti, were each chartered for 65
days to conduct the survey. The survey continues the triennial time series
begun in 1977. This year’s survey exactly replicated those done in 1995
and 1998, which sampled the same stations each year between 50- and 500-m
depth and between Point Conception, California (lat.34º30’N), and mid-Vancouver
Island, British Columbia (lat.49º40’N). Constraints on RACE Division survey
resources this year reduced the number of vessel days to 130 from 140 days
used in 1998 and 160 days in 1995. Despite the reduction, we were able
to sample all but the northernmost 30-40 miles of the survey area.
A total of 539 trawl hauls were attempted during the survey. The performance
of all of these hauls are currently being evaluated to determine whether
the catches accurately represent the abundance and distribution of the
groundfish and invertebrates caught. Catches were sorted by species, weighed,
and counted. Biological information (length, sex, individual weight, maturity,
age structures, etc.) was collected from samples of commercially and ecologically
important species. These data are currently being edited and will be added
to the RACE Division database of trawl survey results. After they are
analyzed, results will be provided to scientific teams assessing West Coast
stocks.
The West Coast Team is indebted to the many scientists from the AFSC, the
Northwest Fisheries Science Center, and other institutions, as well as
to the captains and crews of the vessels, all of whom contributed to make
this survey a success.
By Mark Wilkins.
2001 Gulf of Alaska
Biennial Groundfish
Assessment Survey
The second in the series of biennial bottom trawl surveys of Gulf of Alaska
(GOA) groundfish resources was conducted from 17 May through 25 July 2001.
Unlike the 1999 survey, which sampled the continental shelf and slope of
the GOA from Islands of Four Mountains in the eastern Aleutian Islands
to Dixon Entrance in the eastern GOA, sampling during the 2001 survey was
restricted to the continental shelf of the central and western
GOA.
Prior to the 1999 survey, groundfish resources in the GOA had been surveyed
by the RACE Division on a triennial schedule conducted in 1984, 1987, 1990,
1993, and 1996. The triennial surveys covered the continental shelf of
the GOA in each of the five previous surveys but only included the continental
slope in 1984 and 1987 and again in 1999. It is anticipated that the 2003
survey will again resume sampling the entire GOA continental shelf and
slope.
ITINERARY
Survey sampling was conducted aboard the chartered commercial trawlers Vesteraalen and
Morning Star. The 75-day survey period was divided into
four legs of 18-19 days each. Sampling operations began near the Islands
of Four Mountains (long.170ºW) and extended eastward on the continental
shelf to the eastern boundary of the central GOA off Prince William Sound
(long.147ºW). Sampling occurred at preselected stations, or nearby alternate
stations, in depths ranging from 20 m to 448 m.
OBJECTIVES
The primary focus of the biennial groundfish surveys is to build a standardized
time series of data designed to assess, describe, and monitor the distribution,
abundance, and biological condition of various GOA groundfish stocks.
Specific objectives of the 2001 survey were to:
-
Define the distribution and relative abundance of the principal groundfish
and invertebrate species inhabiting the GOA.
-
Collect data to define various species-specific biological parameters,
such as age, sex, size, growth rates, length-weight relationships, and
feeding habits.
-
Collect integrated net configuration and position data for all trawl
hauls to obtain precise area-swept estimates.
-
Record surface-to-
bottom water column temperatures.
-
Perform special collections as requested by cooperating research groups.
RESULTS
Sampling proceeded from west to east. Each survey vessel was allocated
an equal number of randomly selected stations from each stratum. Some
pre-assigned stations were not sampled due to unsuitable bottom conditions.
In cases where trawlable bottom could not be found at a given station,
a preselected alternate location was sampled. Of the 528 attempted standard
survey tows, 489 tows were successfully completed ranging in depths from
20 m to 448 m.
In the central and western GOA, walleye pollock continued a decade long
downward trend in abundance, declining from 783,000 t in 1990 to 593,000
t in 1999 and to only 209,000 t in 2001. The 2001 pollock biomass which
ranked only sixth among all species, exhibited a 41-59 percent split between
the western and central GOA respectively. Compared to the 1999 population
where the size distribution included many 35- to 60-cm fish, the 2001 population
was composed of three to four times fewer larger fish and twice as many
smaller fish less than 20 cm. Pacific cod, the other important gadid species,
ranked sixth in abundance among all species. Cod declined 10 percent from
285,000 t in 1999 to 256,000 t in 2001 which was evenly divided between
the western (51%) and central (49%) GOA.
Over the central and western GOA survey area, arrowtooth flounder was by
far the most abundant species with a total biomass estimate of nearly 1.4
million t, a 41 percent increase over the 1999 estimate encompassing the
same area. Nearly 93 percent of the biomass was from the central GOA
survey area. The second-most abundant species was Pacific ocean perch (POP)
with a biomass estimate of 712,000 t, a 10 percent increase from the 1999
survey. POP was relatively evenly distributed between the central (60%)
and western (40%) GOA. Northern rockfish, with a biomass estimate of 344,000
t, ranked third in abundance, a 47 percent increase over the 1999 estimate.
Nearly 74 percent of the northern rockfish biomass was located in the
central GOA survey area. Pacific halibut, the fourth-most abundant species,
had a similar biomass distribution with 73 percent of the 347,000 t biomass
estimate also occurring in the central GOA.
By Eric Brown.
Midwater Assessment &
Conservation
Engineering: Triennial Pacific Whiting
Survey
Scientists from the MACE program conducted the ninth triennial echo integration
trawl (EIT) survey of Pacific whiting (Merluccius productus) off the U.S.
and Canadian west coasts from Monterey, California (lat.36ºN) to northern
Vancouver Island, British Columbia (lat.50ºN) between 15 June to 29 July
2001. The purpose of the survey was to collect echo-integration data and
midwater and bottom trawl data necessary to determine the distribution,
biomass, and biological composition of Pacific whiting. The survey was
part of a collaborative effort with Canadian scientists from the Pacific
Biological Station, Nanaimo, British Columbia.
The survey was conducted using the NOAA ship Miller Freeman. About
3,000 nmi of tracklines were covered, and 76 midwater and 14 bottom trawls
were conducted (Figure 1). A centerboard-mounted 38- and 120-kHz scientific
acoustic system was calibrated using standard sphere techniques. Pacific
whiting target strength data were collected using the centerboard transducer
system. A total of 59 Methot trawl hauls were conducted throughout the
survey area to examine the distributional patterns and biological characteristics
of common macrozooplankton species (e.g., euphausiids). An intership calibration
was performed with the Canadian research vessel W.E. Ricker, which surveyed
the area from 50ºN to Dixon Entrance, Alaska. Vessel-mounted acoustic
Doppler current profiler data and surface temperature and salinity measurements
were collected continuously throughout the survey. Vertical profiles of
temperature were also collected at selected sites. Ancillary projects
included sediment sample collections for a surficial sediment map, fish
collections for taxonomy instruction, and collections of near-shore water
samples for a biotoxin study.
Pacific whiting echo sign was broadly distributed along the coasts of California
and southern Oregon from Monterey Canyon (37ºN) to Heceta Bank (44ºN).
Few whiting were detected north of Heceta Bank, with the only substantial
aggregations observed off Barkley Sound, Vancouver Island. Juvenile whiting
(<40 cm) comprised 84 percent of the whiting south of Heceta Bank, whereas
adult whiting (>40 cm) comprised 92 percent of the whiting north of Heceta
Bank.
By Mike Guttormsen.
Gulf of Alaska Steller Sea Lion/Fishery Interaction Study
 |
|
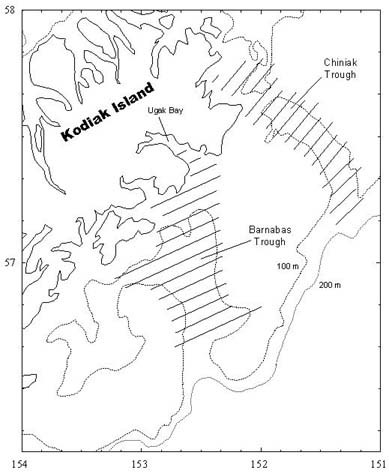
Figure 2. Survey trackline used for each pass during the
August 2001 echo integration-trawl survey of walleye pollock
off the east side
of Kodiak Island, Gulf of Alaska.
|
|
Center scientists completed the field season for the second year of a fishery
interaction experiment during 9-31 August off the east side of Kodiak Island
in the Gulf of Alaska. The study is part of a larger program designed to
evaluate the effect of commercial fishing activity on the prey availability
of walleye pollock to endangered Steller sea lions. The study area consisted
of Barnabas and Chiniak troughs, which served as treatment and control
sites with commercial fishing allowed in one trough and prohibited in the
other, respectively.
The principal objectives for the second year of the experiment were to
use standard acoustic survey methods to describe the spatio-temporal variability
in pollock abundance and distribution patterns within and between the two
troughs over a period of several weeks. Repeated survey passes (Figure 2 above)
were conducted within each trough before and during the fishery to document
whether fishery-induced changes occurred in the fish distribution. Oceanographic
data, to characterize the physical environment, were also collected with
five current meter moorings, drifters, CTDs
(conductivity-temperature-
depth
data), XBTs (expendable bathythermograph data), a vessel-mounted
thermosalinograph,
and acoustic Doppler current profiler.
Acoustic backscattering was classified into primarily three groups: adult
pollock, juvenile pollock, and capelin (Mallotus villosus). The adults
generally formed loose near-bottom aggregations during the day, whereas
the juvenile pollock and capelin formed more discrete aggregations that
were higher in the water column. Preliminary analyses suggested that adult
pollock were distributed throughout Chiniak Trough, but largely restricted
to the northern half of Barnabas Trough during all passes. The geographical
distributions of the juvenile pollock were similar to those of the adults
during all passes. Capelin were often present over the shallower edges
of Chiniak Trough, but were concentrated in the deeper waters within the
southern half of Barnabas Trough.
The size distributions of adults were generally similar within each trough,
with a prominent mode near 60 cm fork length (FL). The size distributions
of juveniles were often characterized with a prominent mode near 20 cm
FL, although a second mode also existed between 30-40 cm in some areas.
Capelin ranged in size between 65-140 mm standard length with prominent
modes centered around 75-85 and 120 mm.
Analyses are currently underway to determine whether significant changes
in fish abundance and distribution patterns were detectable in response
to the commercial fishing activities. Spatial patterns are being explored
through spectral analysis and the use of variograms. In subsequent years
repeated surveys will also be conducted following closure of the 1-2 week
August fishery to describe the duration that a potential fishery-induced
perturbation may persist in the area.
By Chris Wilson.
Shellfish Assessment: Kodiak Laboratory
2001 NMFS Bering Sea Crab Survey
Results
Results of the AFSC’s annual eastern Bering Sea bottom trawl survey for
crab and groundfish are used by the NMFS and the ADF&G to determine allowable
Guideline Harvest Levels (GHL) for Bering Sea king, Tanner, and snow crabs.
The results of the 2001 survey have been used to determine indices of
population abundance that are used to establish the GHLs shown below.
The percent changes in number of crab are relative to the population numbers
determined in 2000. The GHLs are for the combined open-access and CDQ
(Community Development Quota) fisheries unless otherwise noted. The MSST
(Minimum Spawning Stock Threshold) levels are established in the fishery
management plan for Bering Sea king, Tanner and snow crabs. For further
information, contact Dr. Louis J. Rugolo at 907.481.1715 or
Dr. Robert
S. Otto at 907.481.1711.
Red king crab (Paralithodes camtschaticus) Bristol
Bay
Legal males: 5.1 million crabs; 41percent decrease.
Prerecruits: 4.3 million crabs; 41 percent decrease.
Large females: 21.2 million crabs; 22 percent increase.
Outlook: Abundance of mature and legal males declined sharply owing to
mortality, fishery removals, and poor recruitment. Respective indices
remain at low historical (1966-P) levels. Total mature biomass is above
MSST, allowing a 10 percent exploitation rate. Effective spawning biomass
and total mature biomass levels are comparable to levels in 2000.
GHL: 7.15 million lb (3,243 metric tons, t), with 6.614 million lb (3000
t) allocated to the open access fishery, and 0.536 million lb (243 t) to
the CDQ fishery. Fishery will open 15 October 2001.
Red king crab (P. camtschaticus)
Pribilof District
Legal males: 1.8 million crabs; 54 percent increase.
Prerecruits: 2.5 million crabs; 587 percent increase.
Large females: 4.0 million crabs; 549 percent increase.
Outlook: Data suggest an increasing trend in abundance of legal males,
but caution is urged due to extremely low precision of the estimates. Crabs
were highly concentrated. Females are considered to be poorly estimated.
Total mature biomass is above MSST; no fishery threshold has been established
in the plan.
GHL: Fishery will not open in 2001 due to concerns about incidental blue
king crab catch, and to low confidence in the abundance indices.
Pribilof
Islands blue king crab (P. platypus) Pribilof District
Legal males: 0.4 million crabs; 16 percent decrease.
Pre-recruits: 0.1 million crabs; 48 percent decrease.
Large females: 1.6 million crabs; 17 percent increase.
Outlook: Population is in extremely low historical (1974-P) abundance,
and declining trends are not easily detectable. Total mature biomass is
only slightly (6%) above MSST; the male stock is notably below the fishery
threshold definition.
GHL: Fishery will not open in 2001.
St. Matthew blue king crab (P. platypus)
Northern District.
Legal males: 1.1 million crabs; 29 percent increase.
Pre-recruits: 0.6 million crabs; 80 percent increase.
Large females: 0.2 million crabs; 22 percent increase.
Outlook: Population is in extremely low historical (1976-P) abundance following
a steep that commenced in 1997. Total mature biomass is below MSST; the
stock remains in overfished condition. Female abundance is considered
poorly estimated due to their preference for inshore rocky grounds which
are untrawlable.
GHL: Fishery will not open in 2001.
Tanner crab (Chionoecetes bairdi) Eastern
District.
Legal males: 6.3 million crabs; 28 percent increase.
Pre-recruits: 17.3 million crabs; 4 percent decrease.
Large females: 13.2 million crabs; 4 percent decrease.
Outlook: Population has declined steeply (86%) since 1990, and remains
essentially unchanged over the last 5 years. Legal male abundance is at
extremely low historical (1968-P) levels. Total mature biomass is below
MSST; female biomass is below the fishery threshold. The stock remains
in overfished condition.
GHL: Fishery will not open in 2001.
Snow crab (C. opilio) All districts
combined.
Large males: 77.5 million crabs; 2 percent increase.
Small males: 1,791 million crabs; 73 percent increase.
Large females: 1,524 million crabs; 3 percent increase.
Outlook: Abundance of legal males is unchanged, and remains at low historical
(1978-P) levels. Population is experiencing recruitment of crabs to smaller
size groups which may yield legal males in several years conditional on
losses to mortality and the fishery. Total mature biomass is above MSST
and the fishery threshold, but significantly (62%) below the rebuilt threshold.
GHL: 30.82 million lb (13,997 t), with 28.51 million lb (12,930 t) allocated
to the open access fishery, and 2.31 million lb (1,048 t) to the CDQ fishery.
Fishery will open 15 January 2002.
Hair crab (Erimacrus isenbeckii) All
districts combined.
Large males: 1.8 million crabs; 58 percent decrease.
Large females: Not well estimated.
Outlook: Population has declined sharply (72%) since 1995, and remains
in extremely low levels of historical (1978-P) abundance. Recruitment
trends are unclear. The 2000 fishery in the Northern District performed
poorly, yet was targeted at notably larger (2.5-fold) levels of legal male
abundance than that estimated in 2001.
GHL: Fishery will not open in 2001.
By Lou Rugolo.
Fisheries Oceanography Coordinated
Investigations (FOCI): Gulf of Alaska
Juvenile Pollock and Forage Fish Study
For the second year, FOCI scientists continued to study the mesoscale geographic
distribution of young-of-the-year
(age-0) walleye pollock and other forage
species (capelin and eulachon) in the western Gulf of Alaska. Previous
estimates of late-summer abundance of age-0 pollock in the GOA have provided
early indications of recruitment and insights about large-scale, regional
patterns in the geographic distribution of fish density and size. Patterns
evident in these data and the complexity of the GOA coastal marine environment
suggest that geographic variation among age-0 pollock may exist at smaller
scales, such as observed among age-0 density and length data from the western
GOA during 1985-88, possibly in response to habitat. Geographic variation
in nursery habitat is relevant to recruitment processes because suitable
nurseries are the target destination of drifting larvae. By late summer,
the distribution of age-0 juveniles may be indicative of nursery suitability
due to their presumed ability to seek out and maintain position in favorable
areas. The primary objective of this ongoing study, therefore, is to identify
and explain late-summer geographic distribution pattern of age-0 pollock
with regard to mesoscale environmental (topography, temperature, salinity)
and biological (prey taxa) variation, and in relation to fish growth and
feeding success.
During 2-19 September 2001, a grid of 39 stations, representing approximately
10,500 nmi2 of the coastal (near-shore and shelf) and slope area between
the Shumagin Islands and Kodiak Island, was surveyed aboard the Miller
Freeman. Most grid stations were sampled twice: once at night, when age-0
pollock disperse into the water column and again during the day for comparison.
Samples were collected to quantify the composition and abundance of plankton
and micronekton, collect fish samples, and obtain temperature and salinity
profiles. Additional sampling at these and 23 other locations addressed
many secondary cruise objectives:
-
compare and evaluate sampling
methods
-
conduct community analysis of the pelagic
community
-
determine fish distribution near sea lion
rookeries
-
perform
special requests by other scientists.
The reports for this (MF01-10) and the previous MF00-11 (2-20 September
2000) cruise are posted in the Field Operations section of the FOCI website
. Participation in the cruise by scientists outside the FOCI program,
Stan Kotwicki (AFSC), Frank Morado (AFSC), and Maria Ruud (University of
Washington), is greatly appreciated.
By Matt Wilson.
Oshoro Maru Visits
 |
|
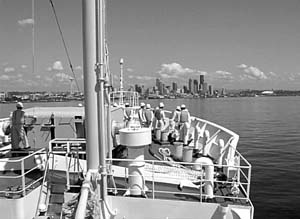
Hokkaido University fisheries research vessel Oshoro Maru
entering Elliot Bay, Washington |
The AFSC and the University of Washington (UW) hosted the Japanese research
vessel Oshoro Maru of Hokkaido University during her port-of-call in Seattle.
The two universities and the AFSC jointly sponsored a 1-day research symposium
“Marine Ecological Studies in the Bering Sea and Eastern North Pacific
Ocean” held at the University of Washington. Members of the Recruitment
Processes Program presented four papers at the symposium. Michael Canino
presented a paper titled “Studies of walleye pollock genetic population
structure in the North Pacific Ocean and Bering Sea.” Bernard Megrey presented
a paper entitled “Modeling marine ecosystem trophodynamics in the North
Pacific Ocean.” Former Recruitment Processes program leader Art Kendall
presented a paper entitled “Rockfish larvae (Sebastes
spp.) In the eastern
Bering Sea.” Lorenzo Ciannelli and Jeff Napp presented a paper entitled
“Foraging impact of age-0 walleye pollock around the Pribilof Islands,
Bering Sea.”
By Jeff Napp.
Up
|

|
quarterly Jul-Sept 2001 sidebar
AFSC Quarterly
Research Reports
July-Sept 2001
Contents
Feature
Auke Bay Lab
National Marine
Mammal Lab
RACE Division
REFM Division
Items
Quarterly Index
Quarterly Home
|
