Abundance and Distribution Surveys for Ice Seals Conducted from the USCG Icebreaker Polar Sea, 6–27 April 2008
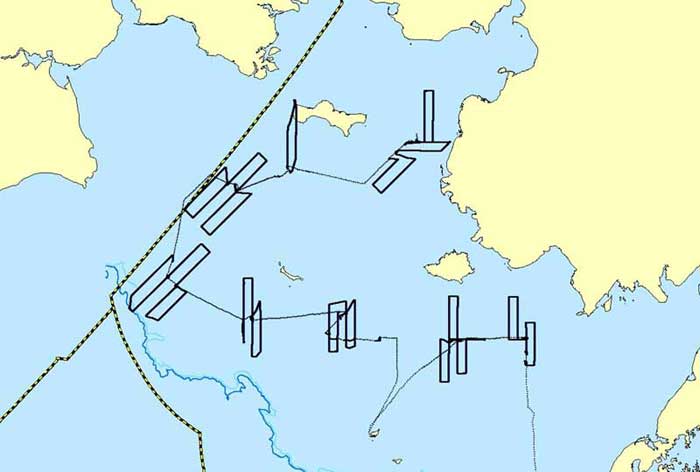
Figure 4. Ship and helicopter tracks of the Polar Sea during the 2008 spring cruise.
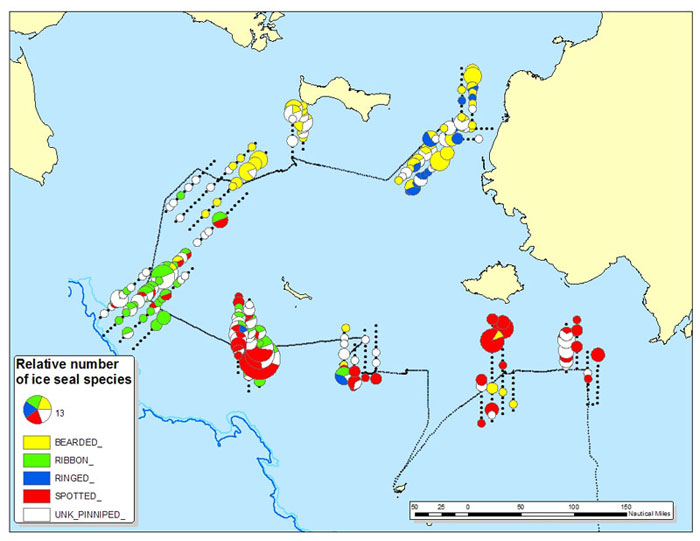
Figure 5. Map showing the abundance and distribution of seals observed during the 2008 Polar Sea cruises. Counts of animals were summed over 5 nmi of survey trackline and are represented by a pie chart. The diameter of the pie chart represents the total number of animals in the 5 nmi of trackline, and the relative proportions of species seen are shown with different colored pie “wedges.”