Status of Stocks & Multispecies Assessment Program
Groundfish Stock Assessments for 2006
Fishery Quota Recommendations
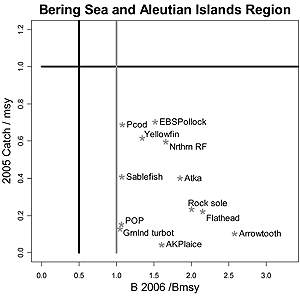
Figure 1. Relative 2006 spawning stock size compared to Bmsy (taken to be
B35% for all species except EBS pollock) versus relative 2005 catch levels compared to
2005 Fmsy levels for BSAI stocks. |
|
The Alaska groundfish management system is based on extensive data available from the NMFS Observer Program and
dedicated research cruises. Catch of target and prohibited species (e.g., salmon, crab, herring, and Pacific halibut)
are estimated at sea or in processing plants to provide real time information to ensure that fisheries do not exceed
total allowable catches (TACs) or violate other fishery restrictions (like time-area closures). Dedicated research
cruises coupled with observer data make it possible to build detailed population dynamics models. Results of these
modeling activities are used to determine the status of individual species.
Establishing TACs involves annual evaluation of the best available scientific information through a series of documents
and public meetings. The first step begins with the preparation of stock assessment and fishery evaluation (SAFE)
reports. These reports contain analyses summarizing the information about the individual stocks and groups, and include
acceptable biological catch (ABC) and overfishing level (OFL) recommendations for future years. The authors of these
reports, generally NMFS scientists, present their findings to the North Pacific Fishery Management Council�s (NPFMC)
groundfish Plan Teams in September and November.
| |
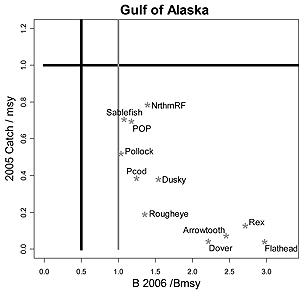
Figure 2. Relative 2006 spawning stock size compared to Bmsy (taken to be
B35% for GOA stocks) versus relative 2005 catch levels compared to 2005 Fmsy
levels for GOA stocks. |
At these meetings, the reports are reviewed, and recommendations for ABC levels are compiled into two SAFE report
volumes (one each for the Bering Sea/Aleutian Islands (BSAI) and Gulf of Alaska (GOA) regions) along with Plan Team
recommendations for ABC, which may differ from author recommendations. The compiled reports are then submitted to the
NPFMC Scientific and Statistical Committee (SSC) for further review. The SSC makes the final ABC recommendation to the
Council and the Council�s Advisory Panel of industry representatives makes TAC recommendations. Finally, the recommended
TAC levels are adjusted (for some species) by the Council to ensure that other constraints (e.g., limiting the sum of all
TACs in the Bering Sea and Aleutian Islands to be less than 2 million t) are met. The following rule applies for all
federally managed groundfish species in a given year: Catch < TAC < ABC < OFL
In practice, catch is often much less than TAC and TAC is often much less than ABC. The multispecies management system
is, therefore, based on the premise that no individual components are overfished or below stock sizes that are considered
detrimental to the ecosystem. Stock assessments can be obtained at:
http://www.afsc.noaa.gov/refm/stocks/assessments.htm.
In 2005 the Resource Assessment and Conservation Engineering (RACE) Divison�s groundfish assessment group conducted a summer
bottom trawl survey in the Gulf of Alaska (the previous such survey was in 2003). This survey, together with past estimates,
indicate that groundfish biomass levels have increased from below 5 million t total in 1984 and 1987 to over 7 million t in
2003 and 2005. The main species groups to increase over this period were rockfish and arrowtooth flounder whereas other
flatfish, Pacific cod, and walleye pollock show general declines.
RACE�s Midwater Assessment and Conservation Engineering (MACE) group conducted three major surveys in 2005: the winter
echo integration-trawl survey in the Shelikof Strait and nearby areas, the winter Bogoslof Island region survey of
spawning pollock from the Aleutian Basin, and preliminary summer work developing a broader-scale echo integration-trawl
survey within the GOA.
Auke Bay Laboratory (ABL) scientists conducted the annual longline survey which is designed primarily for sablefish but
also produces data used in Greenland turbot and some rockfish assessments. This survey covers the slope regions of the GOA
along with segments of the Bering Sea and Aleutian Islands regions. The RACE Division�s groundfish assessment group also
conducted the standard summer-trawl survey for the EBS shelf area. Data from these main survey efforts are critical for
groundfish stock assessments.
Ecosystem considerations sections were enhanced within individual assessment sections in addition to the 314 page document
detailing an overall picture of the ecosystem status, available on the web at http://www.afsc.noaa.gov/refm/docs/2005/EcoChpt.pdf.
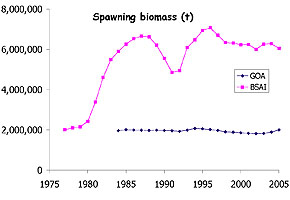
Figure 3. Spawning biomass trends for Bering Sea and Aleutian Islands (BSAI) and Gulf of Alaska (GOA) for
all groundfish stocks combined (sablefish spawning biomass is included in the GOA total). |
|
Presently, projections of 2006 spawning biomass for the main groundfish stocks are estimated to be above their target
stock size (Bmsy) and the 2005 catch levels were below Fmsy levels for both the BSAI
and GOA regions (Figs. 1 and 2 above). Combined spawning biomass estimates for the main species in these regions appear
to be stable overall (Fig. 3). Fisheries for these groundfish species during 2004 yielded 2.0 million metric tons (t)
valued at approximately $1.7 billion after primary processing.
The main pollock stock remains high and again yielded catches just over 1.5 million t. Virtually all flatfish resources
(e.g., rock sole, yellowfin sole, Alaska plaice, and arrowtooth flounder) are at high and healthy levels but catches
remain relatively low. Atka mackerel abundance is stable and at above-average levels. Rockfish species comprise 5%-8% of
the groundfish complex biomass and are generally increasing based on recent surveys. For the main stocks with
age-structured analyses, the spawning biomass trends compared with the average levels since 1977 are shown in Figure 4
(below) for the GOA and BSAI. These figures suggest that stock conditions are fairly evenly split between those that
are above average and below in the past few years.
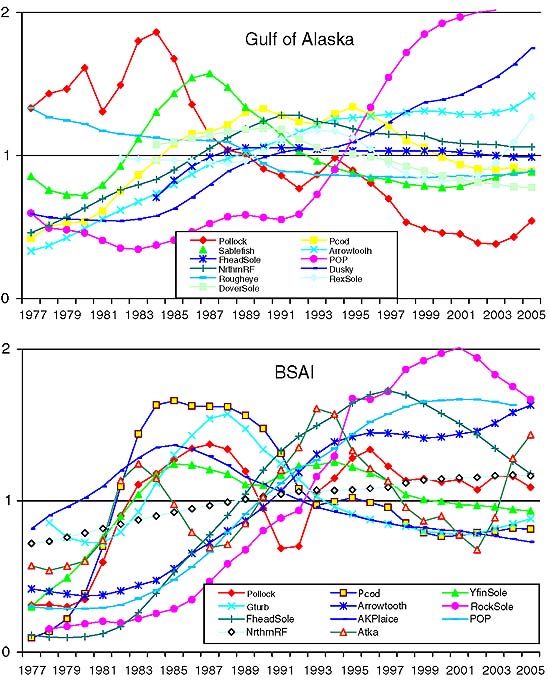
Figure 4. Biomass trends for Gulf of Alaska (GOA) and Bering Sea and Aleutian Islands (BSAI) stocks relative to
their mean level, 1978-2004
>>>continued
 |

|
OND2005 quarterly sidebar
AFSC Quarterly
Research Reports Oct-Dec 2005
Contents
Feature
ABL Reports
FMA Reports
NMML Reports
RACE Reports
REFM Reports
Milestones
Quarterly Index
Quarterly Home
|
