Groundfish Assessment
Annual Bering Sea Crab and Groundfish Assessment Survey
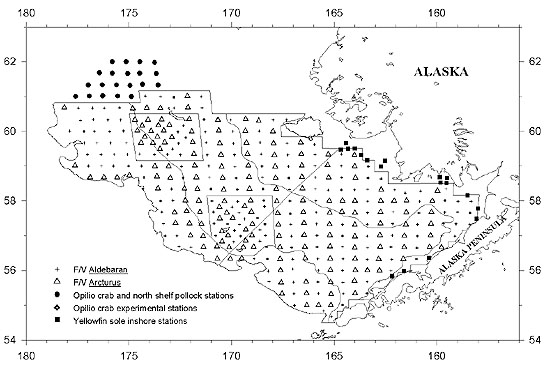
Figure 1. Eastern Bering Sea shelf survey area and sampling stations. |
The Bering Sea Groundfish Assessment Program conducted the annual Bering Sea shelf crab-groundfish bottom
trawl survey from 1 June to 4 August 2004. This years’ survey was performed once again aboard the chartered
fishing vessels Arcturus and Aldebaran, which marks the twelfth consecutive survey using these
vessels. A total of 395 stations were sampled by the two vessels (Fig. 1 above). Nineteen special stations
from inner Bristol Bay were included to continue our evaluation of yellowfin sole spawning populations during
the survey period. Eight extra tows were made around two standard stations that met “Red King Crab Hot Spot”
criteria (>150 legal males in haul). When the catch from a standard station meets this criteria, protocol requires
four additional tows be made at 5 nautical miles (nmi) distance to the north, west, south, and east of the original
station hot spot immediately following the tow.
Abundance estimates for the major groundfish are shown in Table 1 below. The abundance estimate of walleye pollock
decreased from 8,140,573 metric tons (t) in 2003 to 3,751,514 t in 2004. A possible explanation for this decrease
may be the effect of one large survey haul of almost pure pollock on the 2003 EBS survey estimates. All other
species except Greenland turbot showed a slight increase in abundance.
|
Table 1. Bering Sea trawl survey biomass estimates in metric tons. |
Species |
2000 |
2001 |
2002 |
2003 |
2004 |
| Walleye pollock |
5,134,600 |
4,139,837 |
4,842,151 |
8,140,573 |
3,751,514 |
| Pacific cod |
528,500 |
833,272 |
620,502 |
595,826 |
596,988 |
| Yellowfin sole |
1,581,900 |
1,863,656 |
2,016,713 |
2,239,643 |
2,530,599 |
| Rock sole |
2,127,700 |
2,424,813 |
1,921,470 |
2,099,331 |
2,182,086 |
| Flathead sole |
399,300 |
515,275 |
579,649 |
518,189 |
616,668 |
| Alaska plaice |
443,600 |
540,458 |
428,555 |
457,910 |
488,217 |
| Arrowtooth flounder |
340,400 |
409,191 |
356,403 |
542,894 |
547,398 |
| Greenland turbot |
23,000 |
25,347 |
21,545 |
23,685 |
20,909 |
It should be noted that these abundance estimates are the bottom trawl survey biomass estimates
and NOT the estimates of stock condition resulting from stock assessment modeling. Those estimates
will be available in December 2004 when presented to the North Pacific Fishery Management Council.
For comparative purposes Table 1 shows the trend in survey biomass estimates made over the last 5 years.
In general, temperatures were warmer than the long-term mean from 1982. Mean bottom temperature was
3.39°C, compared to the long-term value of 2.54°C. This was the fifth consecutive year of increasing
bottom temperatures reflecting the reduced or missing winter ice cover of recent years. Surface values
were also higher at a mean of 8.29°C and a long-term mean of 6.66°C.
After the standard survey was completed on 25 July, the Arcturus continued on to Pavlov Bay to
conduct the annual shrimp survey. The Aldebaran was used for 7 days by scientists from the
Midwater Assessment and Conservation Engineering (MACE) and the Groundfish Assessment programs in a
collaborative experiment designed to evaluate the behavior of walleye pollock in response to cues from
the oncoming survey trawl vessel. A free-drifting buoy equipped with a calibrated 38-kHz scientific
echosounder was used to observe pollock abundance and vertical distribution as the Aldebaran
towed past the buoy. Data from the acoustic buoy will be used to determine whether walleye pollock
exhibit a behavioral response to the approaching vessel and trawl.
In addition to the standard groundfish survey, the Groundfish Assessment’s Bering Sea team and the
Shellfish Assessment Program participated in a bottom trawl survey of high density locations of snow
crab (Chionoecetes opilio) in cooperation with the Bering Sea Fisheries Research Foundation
(BSFRF) from 6 July to 26 July aboard the chartered fishing vessel Sea Wolf. The main objectives
of the study were to 1) look at abundance of mature snow crab outside the standard survey area; 2) examine
how survey variance estimates are impacted by selection of random survey stations; and 3) look at a
modification to the survey trawl to increase the catchability of crab.
By Erika Acuna
2004 Aleutian Islands Biennial Groundfish Assessment Survey
The third in the series of biennial bottom trawl surveys of Aleutian Islands (AI) groundfish resources
was conducted from 1 June through 9 August 2004. The full series of periodic AI surveys dates back to 1980.
Prior to establishing a biennial schedule in 2000, these surveys had been done on a triennial schedule by
the RACE Division. Surveys conducted prior to 1991 were cooperative efforts involving U.S. and Japanese
vessels and scientists. Since 1991 they have been planned and conducted entirely by the RACE Division. The
primary objective of the surveys is to provide a standardized time series of data to assess, describe, and
monitor the distribution, abundance, and biological condition of AI groundfish and invertebrate stocks.
Secondary objectives are to collect environmental data (e.g.,surface-to-bottom water temperature profiles,
etc.) and to make special collections of biological specimens and data requested by scientists from the
AFSC or other cooperating research groups.
The 2004 AI biennial survey area stretched over 900 nmi from the Islands of Four Mountains (long. 170°W)
to Stalemate Bank (long. 170°E ), including stations on Petrel Bank. In addition, the region between long.
165° and 170°W along the north side of the archipelago is included as the Southern Bering Sea subarea.
Stations range in depth from nearshore to 500 m. Sampling was conducted aboard two chartered commercial
trawlers, the Sea Storm, and the Gladiator. The 70-day survey period was divided into three
legs of 23-24 days each. Sampling began near the Akutan Pass and progressed westward to Stalemate Bank.
Stations were allocated among 45 depth and geographic strata and were preselected randomly from a grid of
potential sites overlaying the survey area. If untrawlable bottom, swift currents, or conflicts with
commercial fishing prevented sampling a station, a nearby alternate station was selected. Of the 471
attempted standard survey tows, 420 were successfully completed, ranging in depth from 26 m to 488 m.
Over the total survey area, the most abundant species in 2004 were, in order, Atka mackerel, Pacific ocean
perch, walleye pollock, giant grenadier, northern rockfish, Pacific cod, and arrowtooth flounder. Increases
in survey-wide estimated biomass since 2002 were observed for all of these species: Atka mackerel by 39% to
1,154,000 t, Pacific ocean perch by 24% to 579,000 t, pollock by 3% to 366,000 t, giant grenadier by 14% to
248,000 t, northern rockfish by 9% to 192,000 t, cod by 38% to 114,000 t, and arrowtooth flounder by 7% to
95,000 t. Results have been supplied to stock assessment authors for updating assessment reports for the
North Pacific Fishery Management Council.
By Mark Wilkins
>>>continued

|

|
Quarterly sidebar
AFSC Quarterly Research Reports July-Sept 2004
Contents
Feature
ABL Reports
NMML Reports
RACE Reports
REFM Reports
Quarterly Index
Quarterly Home
|
