|
|
| Error processing SSI file |
|
||
Polar Ecosystems ProgramHaul-out Behavior of Harbor Seals in Southeast Alaska During the last 2 weeks of July 2002, NMML biologists used the U.S. Fish and Wildlife Service vessel Surfbird as a platform from which to capture harbor seals. The Surfbird anchored in Gambier Bay and Seymour Canal (~ 50 miles south of Juneau) near known aggregations of seals. Biologists used inflatable boats to deploy tangle nets near haulouts and to capture animals resting on the beach. Captured seals were weighed, measured, and tagged with radio transmitters. Automated receiving stations were deployed nearby to monitor each seal’s frequency on a regular schedule to determine daily patterns of haul-out behavior. Data will be downloaded from these stations and the stations disassembled in mid-October. Meteorological data were collected using a weather station deployed near the haulouts. Haul-out behavior will be related to the environmental covariates so that an adjustment can be applied to the aerial survey counts which were initiated 1 week after seal tagging.
By John Jansen, Dave Withrow, and John Bengtson. Abundance Surveys of Alaska Harbor Seals The focus of this year’s survey was the northern part of Southeast Alaska comprised of the area from Kayak Island (Cape Suckling) to Frederick Sound. The study area was subdivided into eight zones so that observers could fly an aerial survey over an entire zone in a 4-hour period centered around low tide. Observers in eight aircraft surveyed terrestrial seal haul-out sites daily (weather permitting) between 5-15 August 2002. Haulouts with few animals were estimated visually during an overflight; large concentrations of seals required photographs from which seals were counted after the flight. All haulouts were precisely mapped using GPS (global positioning system) units so that counts could be added to a time series of site-specific data. An attempt was made to obtain five replicate counts at each site, preferably at different tidal states, so as to better understand local variation in seal numbers. Time of day, tidal state, and weather conditions were noted throughout the survey to aid in a later adjustment of counts based on variation in the tendency of seals to haul out in relation to different conditions. Just prior to the surveys, a companion study examined seal haul-out behavior in relation to environmental covariates at representative sites in the survey region (see related article). By John Jansen, Dave Withrow, and John Bengtson
Photogrammetry of Harbor Seals at Glacial Ice Haul-out Sites In August 2001, photogrammetric surveys were conducted at glacial haul-out sites in the Gulf of Alaska, in conjunction with aerial surveys of terrestrial sites in that region. In August 2002, similar surveys were conducted at glacial haul-out sites in Southeast Alaska, again in conjunction with aerial surveys of terrestrial sites in that region. Together, the 2001 and 2002 photogrammetric surveys encompassed all the known glacial haul-out sites in Alaska (with the exception of a few small haul-out sites that were surveyed successfully using traditional aerial survey techniques). From May to August 2002, monthly photogrammetric surveys were conducted at Disenchantment and Icy Bays, in conjunction with studies of the potential impact of cruise-ship traffic on the behavior and life history of harbor seals at glacial haul-out sites. In addition, a comparative study was conducted in June 2002 during which large-format color photographs and infrared images were collected simultaneously. The data from this comparative study will be used to evaluate the utility of thermal/infrared survey techniques versus the color photography used for all our recent photogrammetric surveys (i.e., those described above).
By Mike Simpkins, Alana Phillips, and John Bengtson.
Cetacean Assessment and Ecology Program
Killer Whale Research in the Gulf of Alaska, Aleutian
Islands, and Bering
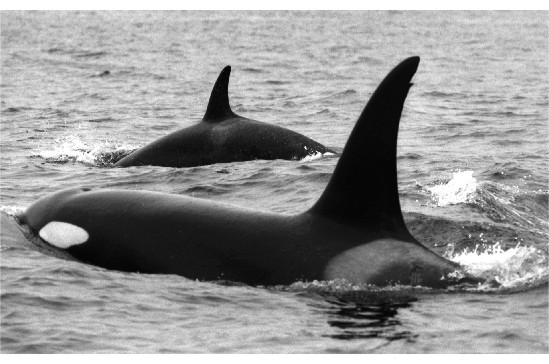
Sea The survey is designed to estimate the abundance of killer whales throughout a large portion of the range of the Steller sea lion western stock, from shore to approximately 30 nmi off shore. The survey was conducted as a regular line-transect survey for all cetaceans (Fig. 1). When killer whales were encountered, the line-transect survey was temporarily suspended in order to collect photographs of killer whale dorsal fins and saddle patches for the identification of individual whales (Fig. 2). When conditions permitted, a small boat was launched (22’ or 19’ rigid hull inflatable) to allow for closer approaches to the whales. Biopsy samples were also collected using a crossbow, and when possible, acoustic recordings were made to identify call types. All of this information will be used to identify whether the whales encountered were mammal eating killer whales (transients) or fish-eating killer whales (residents). Photographs will be compared to existing catalogues of killer whales in Alaska to confirm matches with whales seen previously. Biopsy samples are being genetically analyzed to confirm eco-type, as transients and residents are readily distinguished by their mitochondrial DNA haplotype. A total of 2,256 nmi of trackline were surveyed. Fifteen groups of killer whales were encountered, numbering a total of an estimated 292 individuals. Photographs were taken of all encounters. Eleven biopsy samples were obtained from the 15 groups. Identification of eco-type using photographic matches, genetics, and acoustics has not yet been undertaken. Observations in the field were used to make preliminary assignments to eco-type. Eleven groups were thought to be residents (a total of 276 individuals or 90% of the killer whales seen), 2 groups were thought to be transients (18 individuals, 6%), and 2 groups were not yet assigned to eco-type (11 individuals, 4%). Overall, a total of 602 sightings of cetaceans were made, of a total of an estimated 1,671 individuals. Other odontocetes seen included 213 sightings of Dall’s porpoise (835 individuals), 3 sightings of harbor porpoise (10 individuals), 12 sightings of sperm whale (17 individuals), 3 sightings of Baird’s beaked whale (13 individuals), and 1 sighting of an unidentified beaked whale that was possibly a Stejneger’s beaked whale. Mysticetes seen included 142 sightings of fin whale (265 individuals), 132 sightings of humpback whale (236 individuals), and 36 sightings of minke whale (36 individuals). Biopsy samples were obtained from nine humpback, five sperm, and three fin whales. In addition to using line-transect methods to estimate abundance, the photographs of individual killer whales will also be used to estimate abundance using mark-recapture methods. Photographs from the 2002 DART survey will be combined with photographs taken during the DART 2001 survey, as well as with other surveys in 2001 and 2002, particularly the Aleutian Passes cruise. In May and June of this year, the Aleutian Passes cruise had 26 encounters with killer whales (502 individuals) between Unimak Pass and Tanaga Pass, and collected photographs from nearly all groups, as well as 26 biopsy samples. Additional killer whale information was collected in the Bering Sea from two platforms. CAEP personnel conducted a marine mammal survey on the NOAA ship Miller Freeman during July and August as a piggy-back project to a trawl survey. Finally, CAEP personnel participated in a right whale cruise in the eastern Bering Sea conducted by the Southwest Fisheries Science Center on the NOAA ship McArthur in August. During that survey there were 21 encounters of killer whales, with photographs taken during 10 encounters, and a total of 16 biopsy samples were collected. By Paul Wade, Janice Waite, and Keri Lodge. |
|
AFSC Quarterly Feature Auke Bay Lab National Marine Mammal Lab RACE Division REFM Division Quarterly Index Quarterly Home |
|
|
||
|
|
||