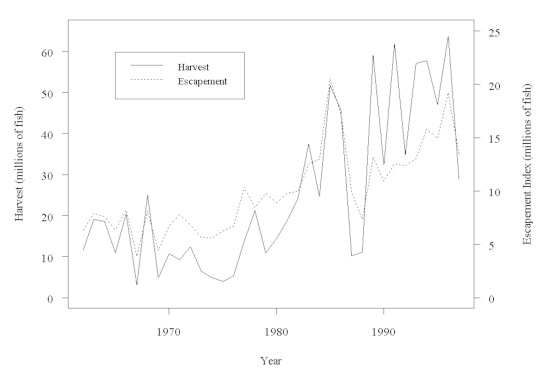
Figure 1. Harvest and escapement of southeastern Alaska pink salmon between 1962 and 1997. Escapement
estimates are based on peak counts of index streams and, therefore, represent an index to total escapement.
Figure 1. Harvest and escapement of southeastern
Alaska pink salmon between 1962 and 1997. Escapement
estimates are based on peak counts of index streams and, therefore, represent an index to
total escapement.
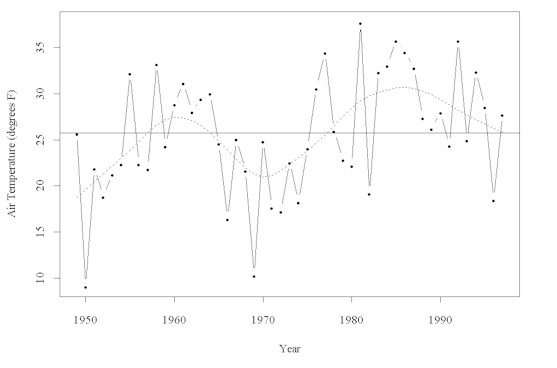
Figure 2. Average daily minimum air temperatures in
southeastern Alaska during January, 1949 to 1997.
The dashed line is a lowess curve (f = 0.35).
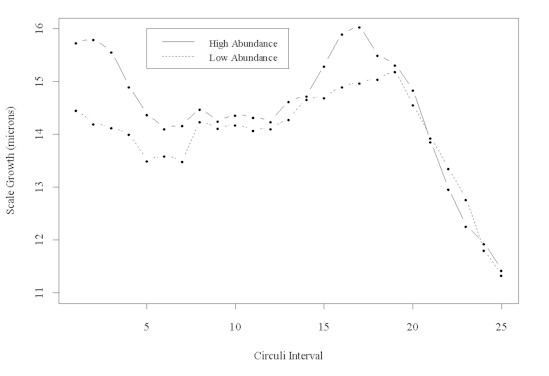
Figure 3. Southeastern Alaska pink salmon scale growth
during years of high (harvest > 30 million)
and low (harvest < 30 million) abundance.
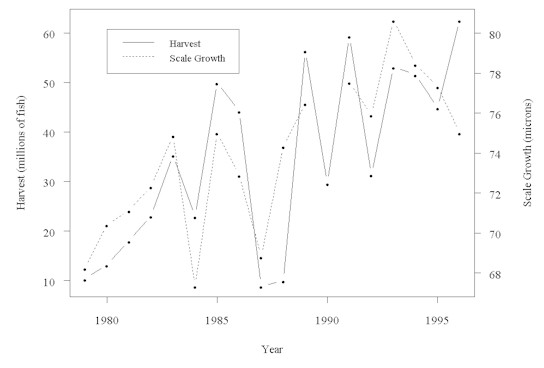
Figure 4. Commercial harvest of southeastern Alaska pink salmon and early marine scale growth of
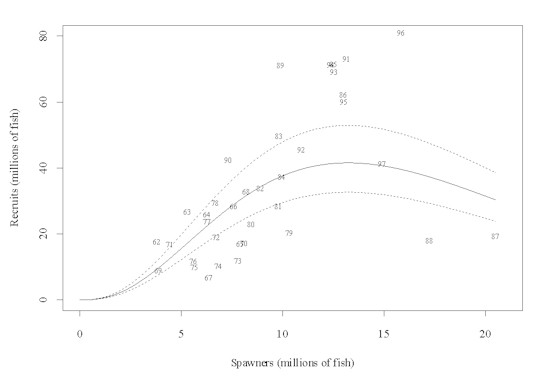
Figure 5. A gamma model with winter air temperatures using spawner-recruitment data from 1962 to 1997.
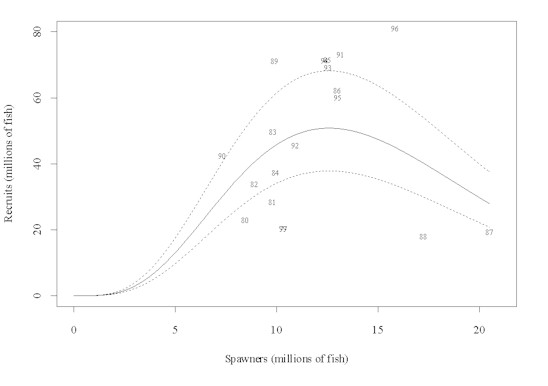
Figure 6. A gamma model with early marine growth using spawner-recruitment data from 1979 to 1997.