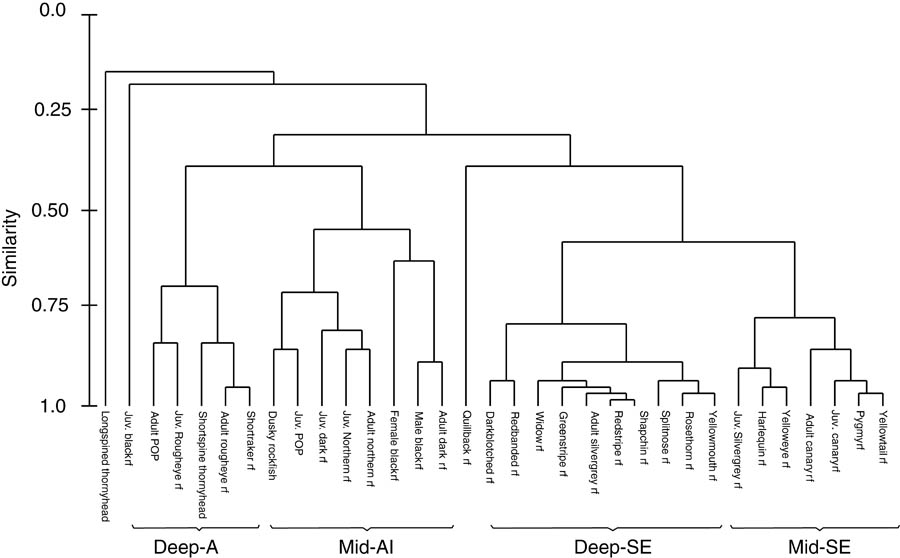
Figure 1. Plot of hierarchical tree showing relative similarity amongst rockfish species-subgroups the result of cluster analysis. The y-axis indicates linkage distance, or larger clusters of increasing dissimilarity, among species derived from the multinomial overlap indices among species-group pairs along the three environmental gradients (depth, position and temperature).