MIDWATER ASSESSMENT & CONSERVATION ENGINEERING (MACE)
Winter Surveys
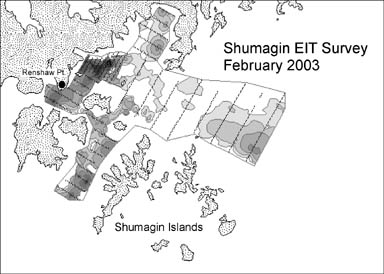
Figure 1. Distribution of pollock echosign in the Shumagin Islands area,
5-12 February 2003.
Lines across mapped distribution represent transect locations. Echosign
was classified into five categories using natural breaks (Jenks). Darker
colors indicate stronger echosign.
Since 1980, scientists from the Midwater Assessment and Conservation
Engineering (MACE) Program have conducted regular echo integration-trawl
(EIT) surveys in the Gulf of Alaska and Bering Sea to assess the
distribution and abundance of walleye pollock . During winter 2003,
surveys were made in the Shumagin Islands area (Fig. 1), the Bogoslof
Island area (Fig. 2), and Shelikof Strait (Fig. 3).
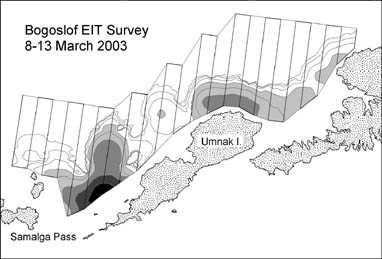
Figure 2. Distribution of pollock
echosign in the Bogoslof Island area, 8-13 March 2003. Transects are
indicated by lines across the mapped area of distribution. Echosign was
classified into five categories using natural breaks (Jenks). Darker
colors indicate stronger echosign.
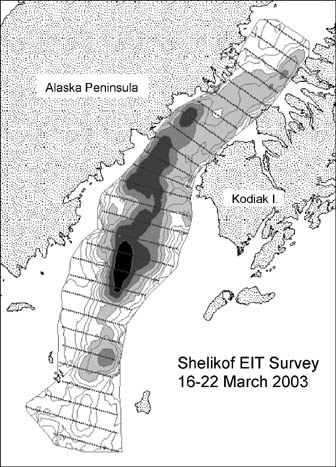
Figure 3. Distribution of pollock
echosign in Shelikof Strait, 16-22 March 2003. Transects are indicated
by lines across the mapped distribution. Echosign was classified into
five categories using natural breaks (Jenks). Darker colors indicate
stronger echosign.
Following the 2002
survey made without trawl samples, a second survey was conducted in
2003, this time with trawl hauls, in Sanak Trough (map not shown). An
expanded version of the Shelikof spawning pollock survey included
additional areas on the shelf. Transects were made along the shelf
break from Chirikof Island to the Middleton Island area.
During the
winter field season, four acoustic system calibrations were conducted:
one during gear trials in Port Susan, Washington; one in Alitak Bay,
Kodiak Island, Alaska; one in Captains Bay, Alaska, during the Bogoslof
survey; and one at the end of the winter field season in the Gulf of
Alaska. The primary objective of these surveys was to determine the
biomass and numerical abundance, as well as various biological
characteristics of the off bottom component of the walleye pollock
populations in these areas. Secondary cruise objectives were to obtain
biological information for other research projects.
In the Shumagin survey, pollock were most abundant off Renshaw Point
(Fig. 1),as in previous years. Most of the pollock biomass in Sanak
Trough was found at the northern end (not shown). As in past years,
large adult pollock in the Bogoslof area were concentrated near Samalga
Pass, with lesser amounts near the north end of Umnak Island (Fig. 2).
The pollock concentrations in Shelikof Strait were highest near the
southern entrance of the strait (Fig.3), as they were last year as
well. However, in 2003 they were distributed over a wider area than in
2002, with higher numbers being observed farther into the strait proper.
The numbers of pollock observed near Chirikof Island were lower than in
2002, and only small numbers were found in the Middleton Island area.
Pollock comprised more than 90% of the midwater and bottom trawl catches
in the Shumagin and Bogoslof surveys. Higher proportions of other
species were found in Shelikof (mainly eulachon) and in other areas of
the northern Gulf of Alaska.
Preliminary analysis of maturity stages indicates that survey timing
was appropriate for the Shumagin, Bogoslof, and Shelikof surveys, but
may have been a little late in the Sanak Trough area. Large
concentrations of spawning or prespawning pollock were not found in the
survey of other areas in the Gulf of Alaska.
These winter surveys marked some important changes in our survey
procedures. Data were logged with SonarData Echologger software and
scrutinized (echosign assigned to species) using SonarData Echoview
software. In addition, for the first time biological data were
collected with the newly acquired Fisheries Scientific Computer System (FSCS)
and both biological data and acoustic data were loaded into our new
database system, MACEBASE for archiving, analysis, and reports.
By Paul Walline.

|
