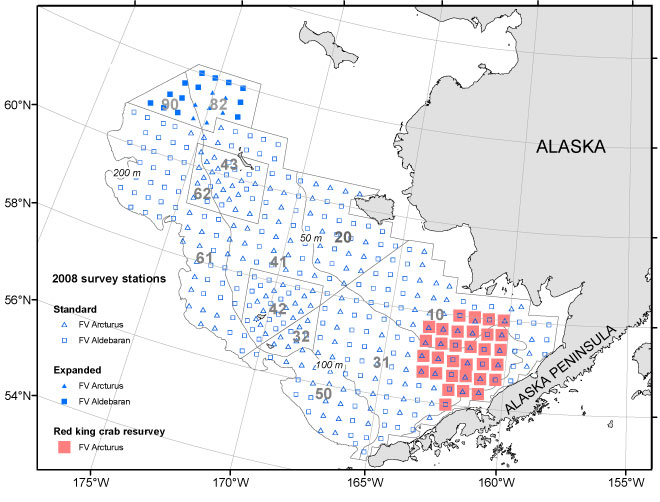
Figure 1. Standard and special study stations sampled during the 2008 eastern Bering Sea continental shelf bottom trawl survey. Geographic regions shown indicate strata used for analysis of groundfish catch data.
 |
|
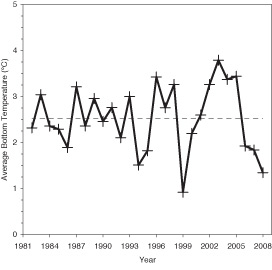
Figure 2. Average annual bottom temperatures standardized by day to 1 July from the eastern Bering Sea groundfish bottom trawl surveys, 1981-2008. |
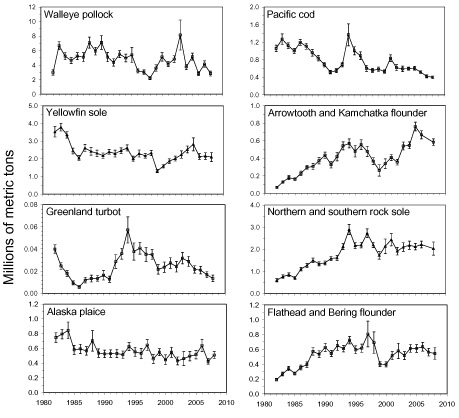 |
| Figure 3. Plot of biomass (in million metric tons) for eight commercial fishes (or group of fishes) on the eastern Bering Sea shelf estimated from standardized trawl survey data collected by the AFSC from 1982 to 2008. Error bars represent the standard errors. |