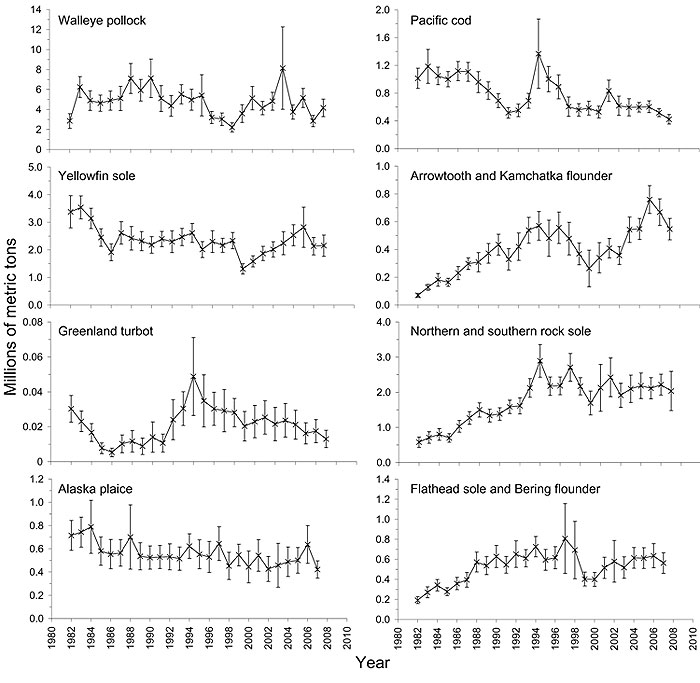
Figure 4. Plot of biomass (x106 t) for eight commercial fishes (or group of fishes) on the eastern Bering Sea shelf estimated from standardized trawl survey data collected by the AFSC from 1982 to 2007. Error bars are 95% confidence limits.
|
Figure 4. Plot of biomass (x106 t) for eight commercial fishes (or group of fishes) on the eastern Bering Sea shelf estimated from standardized trawl survey data collected by the AFSC from 1982 to 2007. Error bars are 95% confidence limits. |