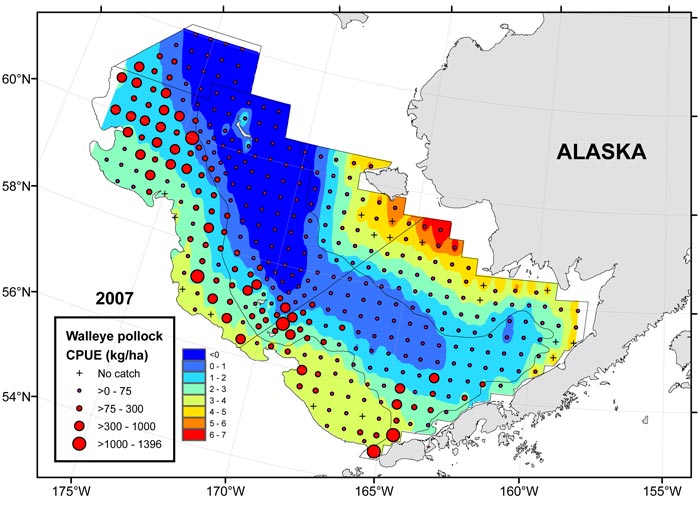
Figure 3. Map of the distribution of average bottom temperatures (°C) in relation to the abundance (kg/ha) of walleye pollock (Theragra chalcogramma) observed during the 2007 eastern Bering Sea groundfish bottom trawl survey.
|
Figure 3. Map of the distribution of average bottom temperatures (°C) in relation to the abundance (kg/ha) of walleye pollock (Theragra chalcogramma) observed during the 2007 eastern Bering Sea groundfish bottom trawl survey. |