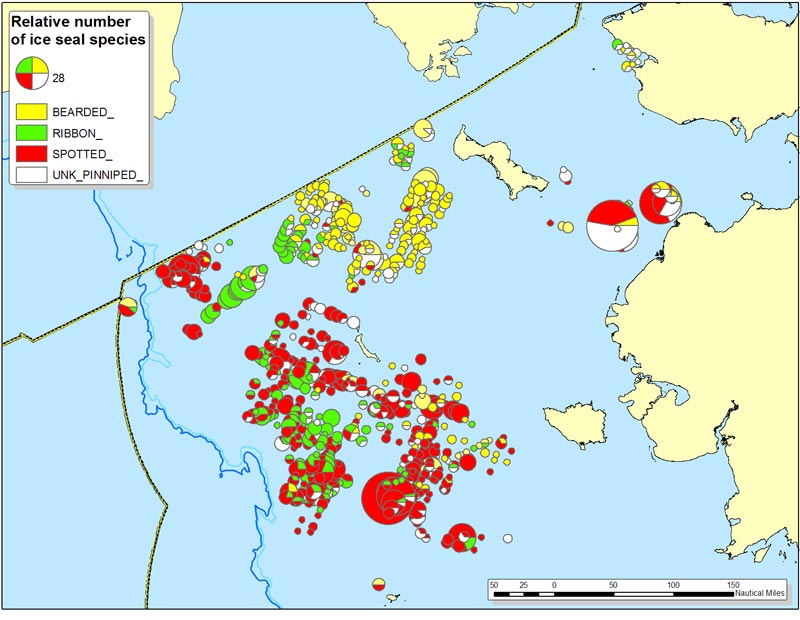
Figure 3. Map showing the abundance and distribution of seals observed during the Healy cruises. Counts of animals were summed over 5 nmi of survey trackline and are represented by a pie chart. The diameter of the pie chart represents the total number of animals in the 5 nmi of trackline, and the relative proportions of species seen are shown with different toned pie “wedges.” Ringed seal sightings are not included in this map because so few were seen during the surveys.