Resource Ecology & Ecosystem Modeling Program
Kerim Aydin Is New REEM Program Leader
Kerim Aydin was appointed Program Leader of the
Resource Ecology and Ecosystem Modeling (REEM) Program as of 13 June
2005. Kerim received a B.S. in mathematical biology from Harvey Mudd
College (1992), and a Ph.D. in fisheries from the University of
Washington (UW) (2000), with a dissertation on the impacts of climate
and prey variation on the ocean growth of Pacific salmon. He has been a
postdoctoral research associate and fishery research biologist with the
AFSC since 1999. Kerim’s main research focus has been on fish trophic
interactions, bioenergetics, and ecosystem-scale predator/prey models.
He has been an affiliate faculty member of the UW School of Aquatic and
Fishery Sciences since 2003 and is serving as cochair on the North
Pacific Marine Science Organization (PICES) Climate Forcing and Marine
Ecosystems Task Team.
By Kerim Aydin
Fish Stomach Collection and Lab Analysis
Laboratory analysis was performed on 1,042 groundfish
stomachs from the eastern Bering Sea, 992 from the Gulf of Alaska, and
2,877 from the Aleutian Islands region. During this quarter, 627
stomachs were returned by fishery observers and no stomachs were
returned from research vessels in the Bering Sea or the Gulf of Alaska.
A total of 8,395 records were added to the groundfish food habits
database. Stomach collection and shipboard stomach analysis is ongoing
for the 2005 field season.
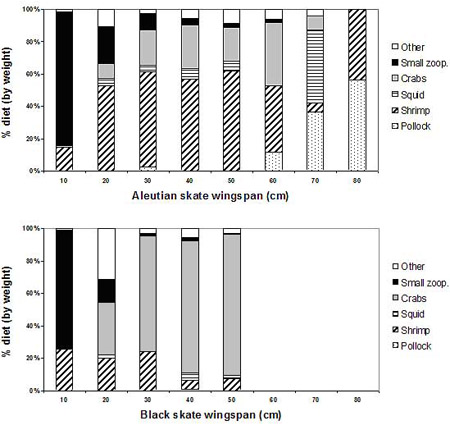
Figure 1. Diet composition (% wet weight) by wingspan of two species of skates from
the 2002 Bering Sea Slope survey. |
Recent completed laboratory analyses include the 2002
Aleutian Islands and Bering Sea Slope biennial surveys. Data are also
available from these surveys conducted in 2004 due to shipboard analyses
of stomach contents beginning that year. Figure 1 shows a subset of diet
data from the 2002 Bering Sea slope survey. Aleutian skates (Bathyraja
aleutica) are distributed over the shallower portions of the slope
(majority of biomass at less than 400 m depth) and have a progression in
diet, with size, from small zooplankton to shrimp to walleye pollock.
Black skates (B. trachura) are distributed below 600 m and
primarily consume deep dwelling crabs at larger sizes. A broader
comparison of skate diets throughout the Alaska regions is in
preparation.
By Kerim Aydin, Troy Buckley, Geoff Lang, and Mei-Sun Yang
Multispecies and Ecosystem Modeling
Kerim Aydin, Jesus Jurado-Molina, Ivonne Ortiz, and
Sarah Gaichas participated in a 2-day review of REEM multispecies and
ecosystem models conducted by the Center for Independent Experts (CIE).
The CIE peer review panel focused on food habits data collection,
modeling methods, modeling implementation (coding), and interpretation
of results. A final report is expected in the summer quarter.
By Kerim Aydin
Ecosystem Considerations
The Ecosystem Considerations section for 2006, part
of the Stock Assessment and Fishery Evaluations (SAFE) report (Appendix
C), was updated in June 2005 and distributed to stock assessment authors
and plan team members. The Ecosystem Considerations section is utilized
to advance our understanding of marine ecosystem dynamics and deliver
ecological, oceanographic, climatic, and anthropogenic indices to stock
assessment scientists and managers.
Interesting trends in some status and trend
indicators were seen in 2004. For example, the number of northern fur
seal pups born on the Pribilof Islands continued to decline. However,
increases in Steller sea lion nonpup counts were observed in 2004 in all
areas except the central GOA (slight decline) and the eastern GOA
(similar counts as 2002). These time series are updated biennially, and
updates to these time series in 2006 will indicate whether these trends
in marine mammal populations continued.
Time trends in bycatch of prohibited species are
examples of ecosystem-based management indices that may provide early
indications of direct human effects on ecosystem components or provide
evidence of the efficacy of previous management actions. Interestingly,
the bycatch of "other salmon" and herring increased markedly in 2003 and
2004. Between 2002 and 2003, herring bycatch increased more than 600%
and "other salmon" bycatch more than doubled. After the dramatic
increase in 2003, the herring bycatch increased again by about 42% and
"other salmon" bycatch almost doubled in 2004.
Most of the herring bycatch in all years occurs in
the Bering Sea-Aleutian Islands (BSAI) trawl fisheries, primarily during
the months of July, August, and September with smaller amounts in
January through March and October. The recent rise in bycatch can be
partly explained by increases of herring biomass; the biomass of
Kuskokwim herring, for example, is estimated to have increased by about
34% in 2003 and about 32% in 2004. Observer data reveals differences in
the distribution of both effort (all pelagic-trawl hauls) and bycatch
(hauls with herring in the species composition) over the years 2002-04.
In most months of 2003 and 2004, the amount of effort and bycatch
increased noticeably in the northwestern-most portions of the fleet’s
range compared to 2002.
Part of the 2003 increase in "other salmon" bycatch
could be explained by the 33% increase in the overall catch of "other
salmon" in 2003 compared to 2002. The "other salmon" bycatch nearly
doubled again in 2004, despite an almost 6% reduction in the overall
catch. In 1994, the North Pacific Fishery Management Council (NPFMC) and
NMFS established the Chum Salmon Savings Area (CSSA), an area in the
Bering Sea closed to trawling in August to minimize chum salmon bycatch.
Unfortunately, in both 2003 and 2004 the highest chum salmon bycatch
rates were outside of the CSSA and after its closure.
Similar problems occurred in 2003 and 2004 with chinook salmon bycatch outside
of the Chinook Salmon Savings Area—the highest bycatch rates were encountered
by the pollock trawl fleet outside of the Savings Area after regulations
had forced its closure. The resulting chinook salmon bycatch was about
28% higher in 2003 and 41% higher in 2004 than the long-term average
over the period 1994-2002. To address these problems, the Council is
considering other means to control salmon bycatch.
By Jennifer Boldt and Terry Hiatt
>>>continued
 |

|
Quarterly sidebar
AFSC Quarterly Research Reports April-June 2005
Contents
Feature
ABL Reports
NMML Reports
RACE Reports
REFM Reports
Items
Quarterly Index
Quarterly Home
|
