Cetacean Assessment and Ecology Program
Cook Inlet Beluga Survey
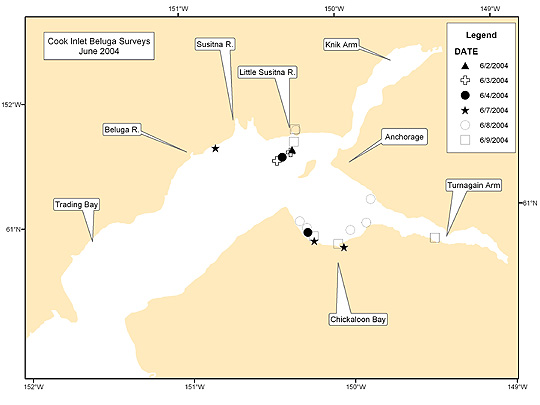
Figure 1. Sightings of beluga whales in Cook Inlet, Alaska, 2-9 June 2004, during the annual aerial surveys,
which have been conducted since 1993. Sighting locations are typical for this time of year.
NOAA Fisheries biologists from the National Marine Mammal Laboratory and the Alaska Regional Office in
Anchorage conducted the annual aerial survey of the beluga whale (Delphinapterus leucas) population
in Cook Inlet, Alaska, from 2 to 9 June 2004 (under Permit 782-1438). All coastal areas and 1,653 km of
transects across the inlet were surveyed during 45 flight hours. The surveys were repeated on five separate
days in the areas where almost all belugas have been found in the past decade: over shallow waters near river
mouths in the northern half of Cook Inlet.
Consistent with the beluga surveys conducted by NOAA Fisheries in Cook Inlet each year since 1993, the 2004
surveys were conducted in a twin-engine, high-wing Aero Commander at an altitude of 244 m and a speed of 185
km/hr. Two observers searched independently on the coastal (left) side of the plane, where virtually all beluga
sightings occurred, while a single observer searched on the right side. Every few hours, four biologists rotated
through the three observation positions and a data recorder position.
Because belugas in Cook Inlet are usually found in discrete groups, the counting protocol called for multiple
aerial passes over each group. Two observers each made four or more independent counts of each group before
switching with another pair of observers who also made four or more counts. Therefore, most groups of whales
were counted 16 or more times each day.
Belugas were observed near the Little Susitna River (daily median aerial counts of 11-99 whales), in Turnagain
Arm (37-50 whales on two days, but none on two other days), and Chickaloon Bay (11-176 whales, the highest numbers
ever seen in this area) (Fig. 1 above). Unlike the previous 1-2 week surveys, in 2004 it was apparent that the
whales were moving between the Susitna area and Chickaloon Bay. For the first time since 1995, no belugas were
seen in Knik Arm and, consistent with the sighting distribution since 1995, no belugas were found south of the
northernmost third of Cook Inlet. Using medians from the observers’ aerial estimates (a very rough but quick index
of relative abundance, which is not corrected for estimates of whales missed), the sum of the daily counts for
June 2004 was 187 belugas. This estimate is not very different from estimates for the past 5 years (174-216
whales), but it is below index counts for years prior to 1998 (264-324 whales).
By Dave Rugh
Photographing Bowhead Whales During the 2004 Spring Migration
The NMML provided funds for aerial photography of the Western Arctic stock of bowhead whales (Balaena
mysticetus) throughout their spring migration past Point Barrow, Alaska. The survey was conducted from
18 April to 7 June 2004, paralleling the project conducted from 12 April to 6 June 2003. Photographs from
these two seasons will be examined for identifiable individuals (most bowhead whales have distinctive marks
on their dorsal surfaces, perhaps from contacting the underside of sea ice). The rate of reidentification of
well-marked individuals seen in both 2003 and 2004 will provide an indication of population size through a
mark-recapture type analysis. Similar studies conducted by the NMML between 1985 and 1992 have resulted in
abundance estimates very similar to those made by shore-based observers counting the whales as they migrate
past the ice edge. Using ice-based counts from 2001, the abundance of this stock of whales is currently
estimated to be greater than 10,000.
As in 2003, the survey in 2004 was carried out in an Aero Commander, a twin-engine, high-wing aircraft
generally flown at altitudes of 130-170 m (400-500 ft) and a speed of 185 km/hr (100 kt). A handheld,
medium-format camera was used to collect 1,443 photographs during the 143 hours of surveys conducted on
41 of the 50 available days, with good aerial photography conditions occurring on 64% of the days. After
the whale images have been processed and cataloged, they will be examined for quality and identifiable
individuals. Reidentification of individuals between years will help answer questions about abundance,
survival rates, calving intervals, and timing within the migration from one year to the next.
All survey activities were coordinated with the NOAA Fisheries Alaska Regional Office, the Alaska Eskimo
Whaling Commission (AEWC), and Alaska’s North Slope Borough (NSB). The project was conducted under NMML’s
Cetacean Research Permit 782-1438.
By Dave Rugh
Meeting of Mexican Marine Mammal Society
Sally Mizroch was invited to give a presentation at the 29th meeting of the Mexican Marine Mammal Society,
in La Paz, BCS, Mexico, 2-5 May 2004. The presentation, “Digital databases: Integrating digital still, GPS
and whale biopsy data enhances field and lab analysis,” coauthored with Universidad Autónoma de Baja
California Sur researcher Úrsula González Peral, described methods for streamlining the analysis of whale
biopsy and photo-identification data.
Due to advances in digital technology, it is now possible to analyze photo-identification data in near-real
time. By using a suite of inexpensive hardware and software, field researchers can build integrated databases
that enhance their ability to correctly identify biopsied individuals. Techniques (developed by NMML
researchers Sally Mizroch and Christy Sims) to edit photographic metadata and export the data into an Access
database were described. By using a simple data form designed to integrate seamlessly with the metadata
automatically collected by digital still cameras, field researchers can collect information, photographs, and
biopsy samples during encounters with groups of whales, enter relevant information into the metadata of each
digital photograph, and create an integrated database in the field. Position data, collected with hand-held GPS
units, can also be imported into the Access database to provide the exact locations of group encounters,
photographs, and biopsy collections. Because biopsy samples are collected near a whale’s dorsal fin and
identification photos are usually of the whale’s tail flukes, analyzing photo-identification data in the field
enhances a researcher’s ability to link photographs of a whale’s dorsal fin and tail flukes and, thus, accurately
identify each biopsied whale. Creating databases in the field also provides the opportunity for less-experienced
researchers to improve their skills and enables researchers to begin analyzing their data immediately upon
returning to their labs. Examples of field databases, created during humpback whale surveys in Mexico, Hawaii,
and Alaska, were used to illustrate the methods described in the presentation.
By Sally Mizroch
>>>continued

|

|
Quarterly sidebar
AFSC Quarterly Research Reports Apr-June 2004
Contents
Feature
ABL Reports
NMML Reports
RACE Reports
REFM Reports
Quarterly Index
Quarterly Home
|
