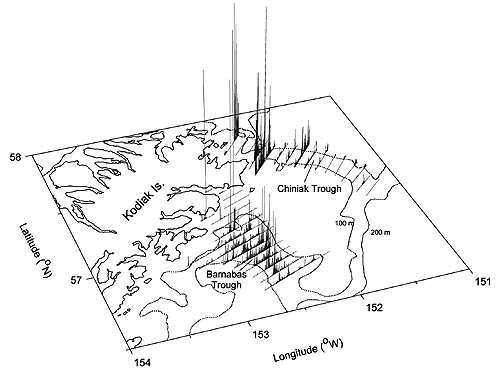
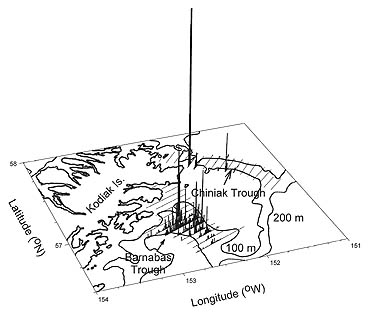
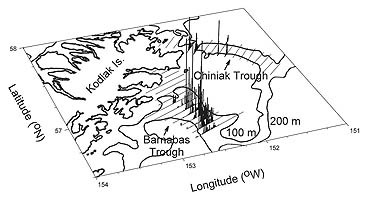
Figures 4a (above) and 4b (below). Acoustic backscatter mainly attributed to schools containing capelin-age-0 mix along
transects during Pass 1 of the August 2000 survey (above) and in Figure 4b (below) containing capelin along transects during
a representative pass from both the pre-fishery period (bottom-left) and fishery period (bottom-right) in August 2001. |
|
|
Figures 5a, 5b (below). Acoustic backscatter attributed to adult
pollock and sub-adult pollock. |
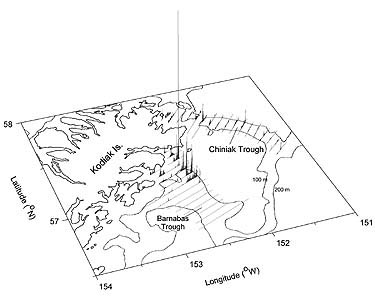
Figure 5a. Adult pollock during Pass 1 of the
August 2000 survey (Z-axis = 35,000) |
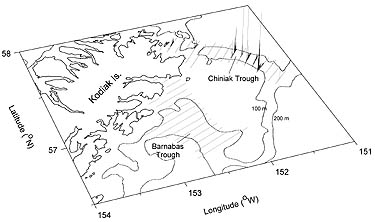
Figure 5b. Sub-adult pollock during Pass 1 of the
August 2000 survey. |
Figure 5c (below)
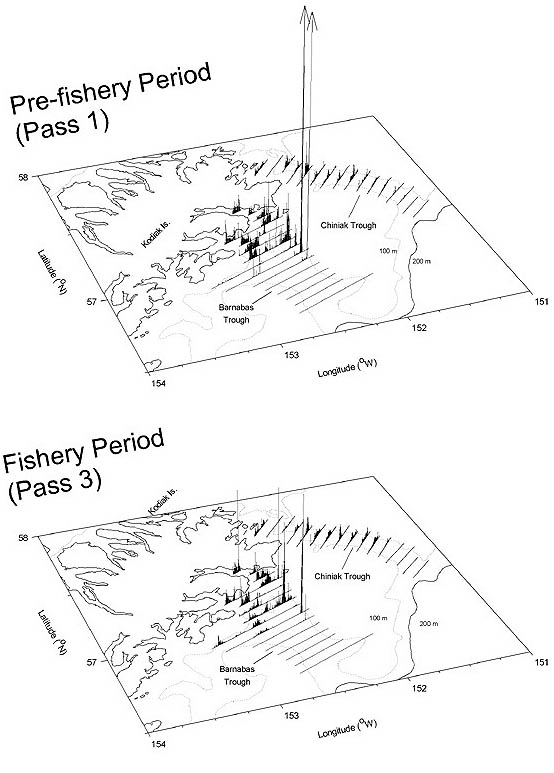
Figure 5c. Acoustic backscatter attributed to adult pollock along transects during a representative
pass from both the prefishery period (top) and fishery period (bottom) in August 2001.
|
Figure 5d (below)
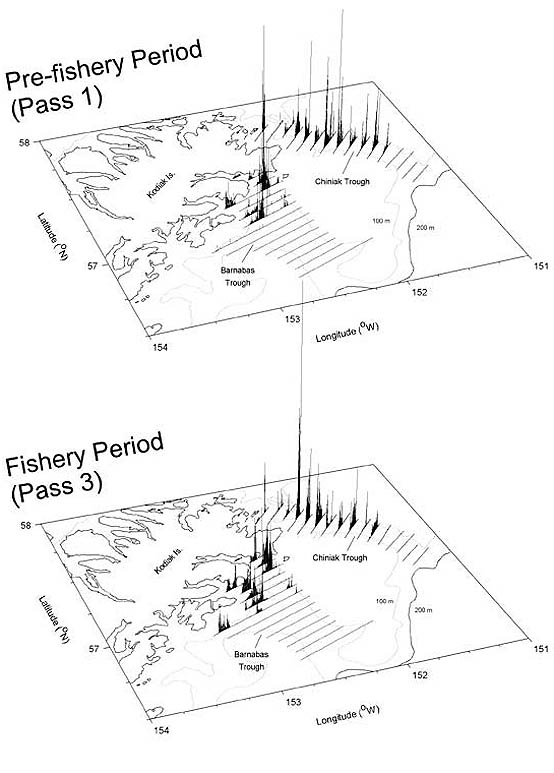
Figure 5d. Acoustic backscatter attributed to age-1 pollock along transects during a representative
pass from both the prefishery period (top) and fishery period (bottom) in August 2001.
|

