|
Estimating Movement and Abundance of Atka Mackerel With Tag and Release Data
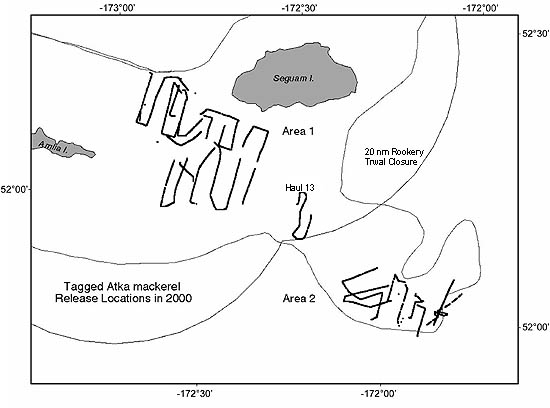
Figure 6. Seguam Pass - the site of the 2000 Atka mackerel tagging study.
Shown are areas inside (Area 1) and outside (Area 2) the 20 nm Trawl Exclusion Zone
as well as the transects along which tagged Atka mackerel were released
Atka mackerel have become the focus of increased attention as one of the major prey
items of the endangered Steller sea lion. They represent one of the
largest groundfish stocks in the Aleutian archipelago, with current estimates of
exploitable biomass in excess of 500,000 metric tons (t). Atka mackerel
occur in dense aggregations in the Aleutian Islands passes and prefer
habitat with strong currents. Atka mackerel have been observed at great
densities and are extremely patchily distributed in space and time.
In order to prevent possible prey shortage for the Steller sea lions, the National Marine
Fisheries Service (NMFS) established 20-nautical mile (nmi) no-trawl zones
around six Steller sea lion rookeries in the eastern Aleutian Islands in 1991. In 1998,
further measures were taken to spread out fishing effort
temporarily as well as spatially. Instead of one fishing season per year,
an A (winter) and B(summer) season were mandated, and more quota was assigned to
be caught outside of critical habitat. These restrictions affected the
fishery by shifting effort away from traditional fishing grounds, and the
question arose as to the efficacy of the no-trawl zones and the impact of the
fishery on Atka mackerel local abundance and movement. Estimates of Atka
mackerel abundance on small time- and space-scales were needed to identify
potential changes in behavior or movement of Atka mackerel that could be
attributed to the fishery. Mark recapture estimation methods were
used to estimate local abundance and small-scale movement of Atka mackerel
around Steller sea lion rookeries and to examine potential fishery effects on
Atka mackerel movement and abundance.
During August 1999, NMFS scientists in cooperation with the School of Fisheries and
Aquatic Sciences, University of Washington, conducted a tagging feasibility
study as part of a trawl survey in Seguam Pass in the Aleutian Islands. During
the study a mortality experiment was carried out on board with four live tanks,
which held fish for 12 days. Two other live tanks were used to hold fish for
opportunistic release; 936 tagged fish were released in the area open to
the fishery. The results of the mortality experiment and recoveries by the
fishery showed that the tagged fish survived well and that the fishery was able
to identify and report tagged fish.
In July-August 2000 a full-scale tagging study was conducted in Seguam Pass. Fish
were caught and released in two dedicated areas: inside (Area 1) and outside
(Area 2) the Trawl Exclusion Zone (Figure 6 above). Atka mackerel were
caught with trawl gear, transferred into live tanks, tagged, and released in a
continuous transect pattern (Figure 6 above). The tag loss rate was estimated by
double tagging approximately 20% of all fish released. Total number of
fish released was 6,096 inside the Trawl Exclusion Zone and 2,677 fish outside
the Trawl Exclusion Zone.
Tagged fish were recovered by the fishing fleet during its regular fishing procedures
with the help of fishery observers in the area open to the fishery (Area 2). In the
area closed to the fishery (Area 1), the fishing vessel Seafisher,
a 220-foot factory trawler, was chartered by NMFS to recover tagged Atka
mackerel. Approximately 34,891 fish were examined for tags in Area 1
by the charter vessel, and 3,960,000 fish were examined for tags in Area 2
by the commercial fleet and the charter vessel combined. The tag reporting
rate was estimated by randomly seeding ten dummy tags per haul into the catch
that was examined for tags. This was done for every haul on the charter
vessel and for all hauls sampled by the observers on the commercial vessels.
| |
Table 1. Tag recoveries by the two fishery events
and by the NMFS charter vessel.
|
| |
Recovery of tags by the commercial fishery |
| |
Recovered Area 1 |
Recovered Area 2 |
|
Tagged Area 1 |
0 |
|
0 |
|
|
Tagged Area 2 |
0 |
|
77 |
|
| |
Recovery of tags by the NMFS charter vessel |
| |
Recovered Area 1 |
Recovered Area 2 |
|
Tagged Area 1 |
11 |
|
1 |
|
Tagged Area 2
|
3
|
|
12
|
|
|
|
Results of the tag recoveries are summarized in Table 1 (right). The commercial fleet
recovered 77 tags in Area 2, all of which had also been released in Area 2;
therefore, no movement was reported. The charter vessel recovered 14 tags in
Area 1, out of which 3 tags had moved from Area 2; the charter vessel recovered
13 tags in Area 2, out of which 1 tag had moved from Area 1. The results from
all recoveries show that only 1 tag out of 90 tags recovered in Area 2 had moved
and 3 tags out of 14 tags in Area 1 had moved.
The tagging model used was an integrated model using maximum likelihood to
estimate all parameters simultaneously. There were four components of the model
including expected tag recoveries, tag loss, tag survival, and tag reporting.
Parameter estimates with 95% confidence intervals are summarized in Table 2.
Numbers of fish per area were converted into metric tons by calculating the
average weight of Atka mackerel at the time of recovery. Biomass estimates from
the tagging model ranged from 117,900 t in Area 1 to 82,057 t in Area 2 (Table 2
below).
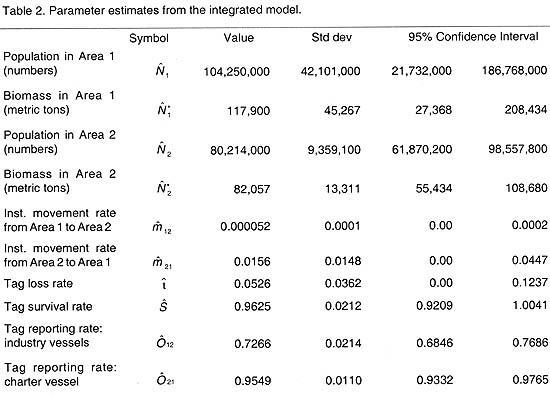
Table 3. Movement rates per area over time.
|
| |
Time event |
Days since
tagging (dk) |
Value |
Lower
C.I. |
Upper
C.I. |
|
Movement rate p12 |
Tag release |
1 |
|
0.0001 |
0.0000 |
0.0002 |
|
(from inside area |
Fishery |
37 |
|
0.0019 |
0.0000 |
0.0068 |
|
to outside area) |
Charter |
59 |
|
0.0031 |
0.0000 |
0.0109 |
|
|
Fishery (CDQ) |
107 |
|
0.0056 |
0.0000 |
0.0197 |
Movement rate p21 |
Tag release |
1 |
|
0.0154 |
0.0000 |
0.0441 |
|
(from outside area |
Fishery |
37 |
|
0.4376 |
0.0000 |
1.0000 |
|
to inside area) |
Charter |
59 |
|
0.6006 |
0.0000 |
1.00002 |
|
Movement rate was calculated as instantaneous or daily movement rate and was
then extrapolated to a corresponding movement rate for days in the water since
release (Table 3 above). Estimated movement rate from inside (Area 1) to outside (Area
2) the Trawl Exclusion Zone after 59 days (the time of the recovery charter) was
less than 1% of the population (Figure 7a below). Estimated movement rate was much
greater for fish moving from the open area to the closed area at 60% of the
population (Figure 7b below). However, the recovery effort inside the closed area was
much smaller, so there is a high degree of uncertainty around the estimate of
movement rate into the closed area – the 95% confidence bounds included zero
and 100% of movement.
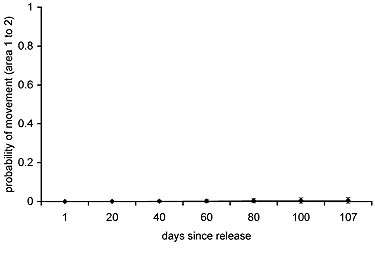
Figure 7a. Probability of movement from Area 1 to 2. Instantaneous movement
rate estimated for both sexes together and extrapolated to movement rate for
days out in the water since release. (Error bars are
the 95% C.I.)
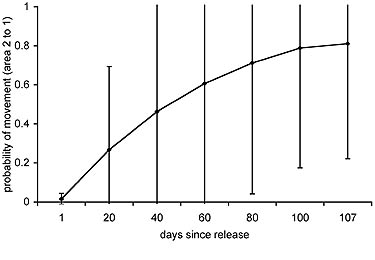
Figure 7b. Probability of movement from Area 2 to 1. Instantaneous movement rate estimated for both sexes together and extrapolated to movement rate for days out in the water since release. (Error bars are the 95% C.I.)
In addition to examining local abundance and movement rates, sex ratio at time
of tagging and at time of tag recovery was examined and compared. Sex ratio for
all fish examined for tags at the various recovery events was calculated using
sexed length frequency data that were taken for each haul during the recovery
charter and for all hauls sampled by observers during the commercial fishery tag
recovery. It appeared that sex ratio in the population was not the same in both
areas and changed from time of release in July to time of recovery in September
and November. In both areas there was a much greater percentage of males present
at time of recovery than at time of tagging. This suggests that male and female
populations might have different movement rates; therefore, the model was run
separately for both sexes.
| |
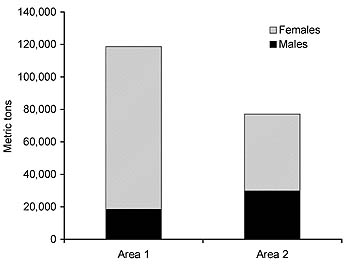
Figure 8. Sex ratio of the female and male biomass
in metric tons per area.
|
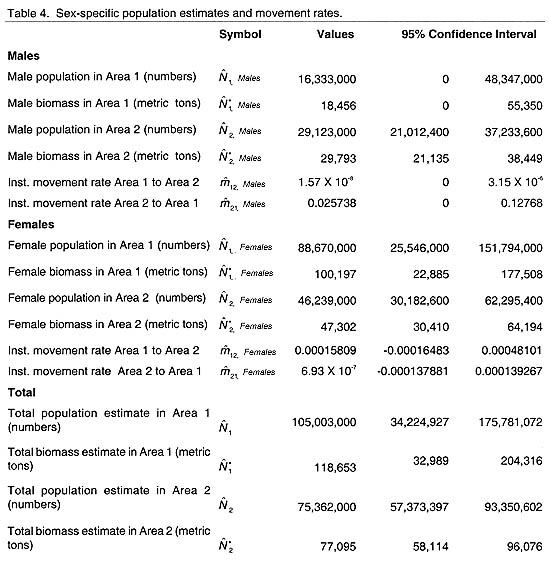
Total population sizes were approximately the same as the estimates for both
sexes combined (Table 4 above). However, the model estimated the biomass in Area 1 to
consist mostly of females; with 100,197 t females and only 18,456 t males. In
Area 2 the sexes were more evenly distributed with 47,302 t of females and
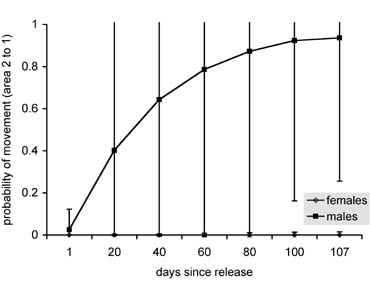
29,793 t of males (Figure 8 right) Movement rates also differed dramatically, as it
appeared that females were not showing much movement at all while the males were
responsible for the large point estimate of the movement rate from Area 2 to
Area 1 (Figures 9b, 9b below). This movement rate, however, was associated with large
confidence bounds, and not much inference can be drawn from this result. It
makes sense, however, that the model associated a high rate of movement for
males from Area 2 to Area 1: the sex ratios in both areas were quite different
between tagging and recovery periods, and it appeared that an influx of males
might cause the shift in sex ratios. It is noteworthy that this model does not
allow for immigration or emigration of fish.
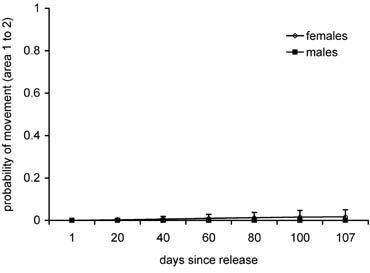
Figures 9a, 9b. Instantaneous movement rate estimated for each
sex separately and extrapolated to movement rate for days out in
the water since release. Open diamonds represent data for
females, solid squares represent data for males (error bars are
the 95% C.I.). Top figure shows the probability of
movement from Area 1 to 2 and the bottom figure shows the
probability of movement from Area 2 to 1.
|
|
Results from the Atka mackerel tag and release study suggest that there is
relatively little movement of Atka mackerel from inside to outside the Trawl
Exclusion Zone, indicating that the Trawl Exclusion Zones are effective at
protecting Atka mackerel near Steller sea lion rookeries around Seguam Pass.
Caution should be used in applying these results to other areas, with resident
Atka mackerel populations and fisheries of different size and distribution. To
examine geographical variation in movement and local abundance, FIT scientists
will begin a parallel tag release-recovery study in the Tanaga Pass area (west
of Seguam Pass) in 2002. The data described above provide information on local
abundance and movement rate of a fished population of Atka mackerel. To increase
the precision of the movement rate estimate from outside to inside the Trawl
Exclusion Zones, we will increase the number of tagged Atka mackerel from
approximately 8,800 to 25,000 tags released in Seguam Pass and will release
12,000 tags in Tanaga Pass. To address the question of whether and how fisheries
impact Atka mackerel, FIT scientists will conduct tag recovery surveys both
before and after the September 2002 Atka mackerel fishery in Seguam Pass. The
specific goals of this experiment are to determine whether localized depletion
occurs in a fished area (outside the Trawl Exclusion Zone) and whether movement
rates into and out of the Trawl Exclusion Zone are influenced by fishing.
Future Research
In addition to those mentioned above, FIT researchers are planning additional
studies. For example, FIT plans to implement an analysis of the potential
effects of winter Bering Sea trawl fisheries for Pacific cod on the local
distribution and abundance of Pacific cod in December 2002. This experiment will
be conducted using pot gear. The design of this experiment calls comparison of
the ratios of CPUE (catch-per-unit-effort) before and after fishing in fished
and un-fished sites. FIT researchers in collaboration with RACE scientists hope
to expand their studies on pollock to additional regions and other seasons. The
experiments described here and those planned for the near future focus on
identifying commercial fishing effects on the distribution and abundance of
Steller sea lion prey. If an effect is detected, research will focus on
detecting what levels of fishing effort illicit marked changes in prey
distribution and abundance. These experiments will play an integral role in the
design and evaluation of management strategies for commercial fisheries in
Federal waters. FIT also anticipates that members of this research team will
provide information that is directly relevant to the development of biological
opinions and stock assessment advice.
Up

|

|
Quarterly April-June 2002 sidebar
AFSC Quarterly
Research Reports
April - June 2002
Contents
Feature
Auke Bay Lab
National Marine
Mammal Lab
RACE Division
REFM Division
Quarterly Index
Quarterly Home
|


